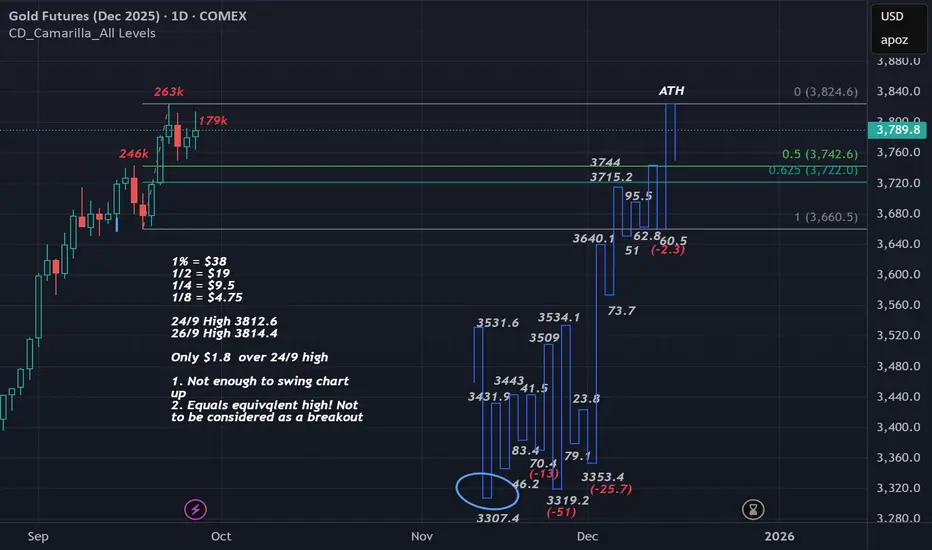
23/9 High volume 262,918 sign of selling and high of 3824.6
Weekly swing : 200% of previous swing range = 3806.8 which equals $17.8 over resistance level.
Not even 1/2 % over resistance level.
The high volume and doing 200% of previous could be a sign sell off for a reaction to the 50%. We have not even tested the 50% of the daily swing ever lone the test of the weekly 50%.
Friday 26/9 High 3814.4 with lower volume and only $1.8 over the high of 24/9. Note 25/9 was an inside day so this day is ignored for our swing chart and we need to wait for a break of the 24th or see if it sells off.
면책사항
해당 정보와 게시물은 금융, 투자, 트레이딩 또는 기타 유형의 조언이나 권장 사항으로 간주되지 않으며, 트레이딩뷰에서 제공하거나 보증하는 것이 아닙니다. 자세한 내용은 이용 약관을 참조하세요.
면책사항
해당 정보와 게시물은 금융, 투자, 트레이딩 또는 기타 유형의 조언이나 권장 사항으로 간주되지 않으며, 트레이딩뷰에서 제공하거나 보증하는 것이 아닙니다. 자세한 내용은 이용 약관을 참조하세요.