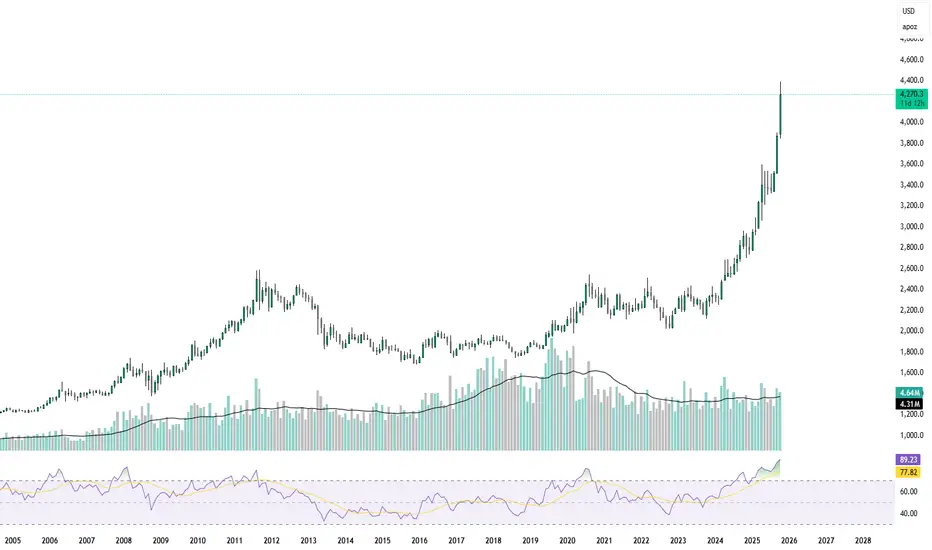
Since 1970, gold (GC – CME) has experienced six major crashes, each occurring right after eight consecutive green weekly closes.
In every case, the market first showed what seemed like a “healthy buying phase” — strong optimism and aggressive inflows — before a sharp reversal took place.
Historical data reveals a clear pattern:
In the first week after the streak, gold fell an average of 11.8%.
By week four, the average drawdown deepened to 23.5%.
And within eight weeks, the total average decline reached up to 33%.
This pattern suggests that gold tends to build extreme bullish momentum before major corrections, as traders chase prices higher and sentiment detaches from fundamentals.
Currently, after another extended streak of weekly gains, gold once again sits in the same statistical zone that historically preceded a significant pullback.
If history repeats itself, we may soon witness a sharp correction — a natural reset after an overheated rally.
meitar Fadida Israel
면책사항
해당 정보와 게시물은 금융, 투자, 트레이딩 또는 기타 유형의 조언이나 권장 사항으로 간주되지 않으며, 트레이딩뷰에서 제공하거나 보증하는 것이 아닙니다. 자세한 내용은 이용 약관을 참조하세요.
meitar Fadida Israel
면책사항
해당 정보와 게시물은 금융, 투자, 트레이딩 또는 기타 유형의 조언이나 권장 사항으로 간주되지 않으며, 트레이딩뷰에서 제공하거나 보증하는 것이 아닙니다. 자세한 내용은 이용 약관을 참조하세요.