This chart forms part of a larger research note. None of the information posted here (TV) should be considered financial advice.
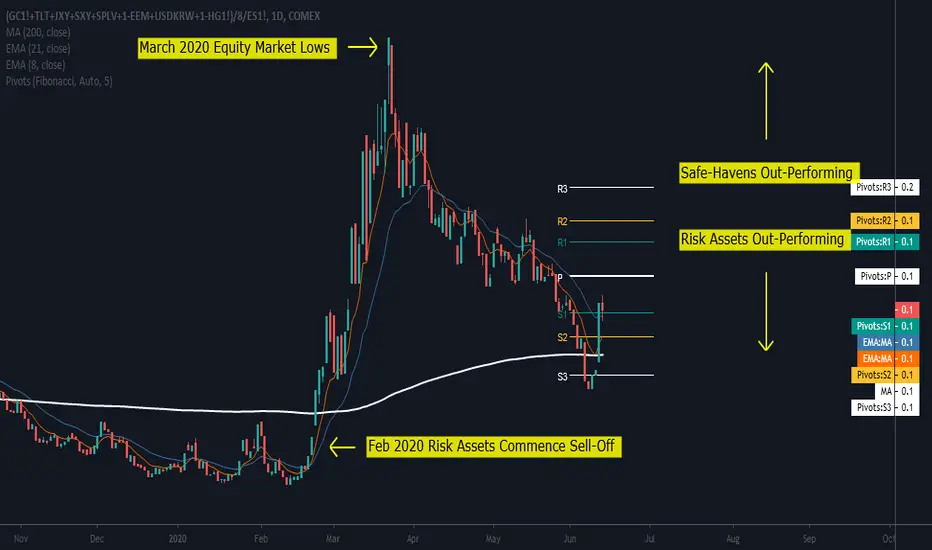
On a relative basis, safe-havens have out-performed risk assets for the past week. This is highlighted by the relative chart, using our custom Global Safe-Haven Index (SHIX) versus the S&P500 E-mini Futures (as a wide proxy for risk assets). Support was found on support level 3 (S3) as well as the flat 200-day simple moving average. The last close (Friday, 12 June) has seen the relative price closing above both the 8 and 21-day exponential moving average, both of which have started to lose downside momentum. Going forward (with a short to medium term view), I am expecting the Global Safe-Haven Index to challenge risk assets.
On a relative basis, safe-havens have out-performed risk assets for the past week. This is highlighted by the relative chart, using our custom Global Safe-Haven Index (SHIX) versus the S&P500 E-mini Futures (as a wide proxy for risk assets). Support was found on support level 3 (S3) as well as the flat 200-day simple moving average. The last close (Friday, 12 June) has seen the relative price closing above both the 8 and 21-day exponential moving average, both of which have started to lose downside momentum. Going forward (with a short to medium term view), I am expecting the Global Safe-Haven Index to challenge risk assets.
면책사항
해당 정보와 게시물은 금융, 투자, 트레이딩 또는 기타 유형의 조언이나 권장 사항으로 간주되지 않으며, 트레이딩뷰에서 제공하거나 보증하는 것이 아닙니다. 자세한 내용은 이용 약관을 참조하세요.
면책사항
해당 정보와 게시물은 금융, 투자, 트레이딩 또는 기타 유형의 조언이나 권장 사항으로 간주되지 않으며, 트레이딩뷰에서 제공하거나 보증하는 것이 아닙니다. 자세한 내용은 이용 약관을 참조하세요.