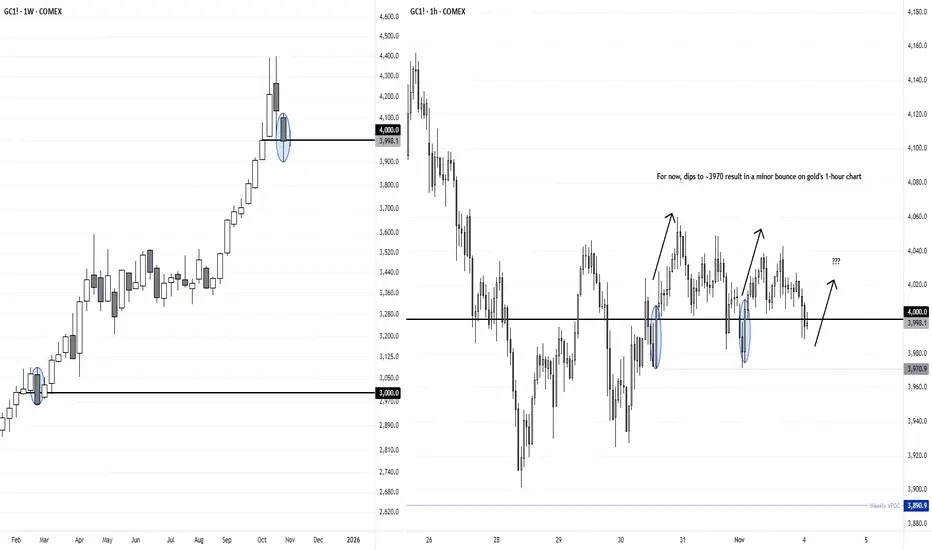
Gold closed lower for a second week, and prices are now meandering around the 4000 handle. We can see that the last time it tried to break back below such a milestone level, gold bear sonly managed a single weekly close below 3000 before the rally continued.
I doubt we’ll see another 1000 directly from current levels, and my bias is actually for the retracement to eventually dip lower before its bullish trend resumes. But for now, traders could seek false breaks below 4000 in anticipation of at least a minor move higher.
My video from Friday provides a bullish bias on the daily timeframe over the near term which still stands. But for those on intraday timeframes, notice that bullish engulfing candles have appeared on the 1-hour chart on the prior two occasions that gold tried (but failed) to break beneath 4000. It’s as if gold bears are trying to force the golden beach ball below its 4000 waterline.
Matt Simpson, Market Analyst at City Index
관련 발행물
면책사항
이 정보와 게시물은 TradingView에서 제공하거나 보증하는 금융, 투자, 거래 또는 기타 유형의 조언이나 권고 사항을 의미하거나 구성하지 않습니다. 자세한 내용은 이용 약관을 참고하세요.
관련 발행물
면책사항
이 정보와 게시물은 TradingView에서 제공하거나 보증하는 금융, 투자, 거래 또는 기타 유형의 조언이나 권고 사항을 의미하거나 구성하지 않습니다. 자세한 내용은 이용 약관을 참고하세요.