Today we will take a look at the Daily chart on GBPCHF.
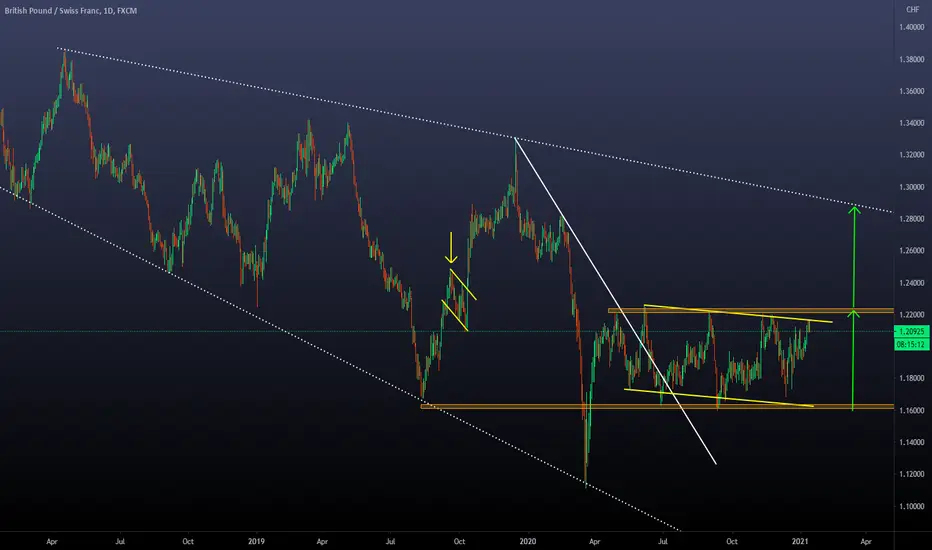
-The main structure we have is the expanding descending channel
-Inside the channel, we can see a range formed by the support zone at 1.16000 and the resistance zone at 1.22000
-Technical theory tells us that the expected movement after a breakout of a range is the extension of it. We can see that the extension provides a target that converges with the higher trendline of the descending channel
-If we have a breakout, we can expect to see a corrective structure with similar proportions to the one that happened before (yellow arrow) before the big bullish movement
-This is an interesting Forex Pair to keep an eye on due to the bullish potential it can provide if we have a breakout!
면책사항
해당 정보와 게시물은 금융, 투자, 트레이딩 또는 기타 유형의 조언이나 권장 사항으로 간주되지 않으며, 트레이딩뷰에서 제공하거나 보증하는 것이 아닙니다. 자세한 내용은 이용 약관을 참조하세요.
면책사항
해당 정보와 게시물은 금융, 투자, 트레이딩 또는 기타 유형의 조언이나 권장 사항으로 간주되지 않으며, 트레이딩뷰에서 제공하거나 보증하는 것이 아닙니다. 자세한 내용은 이용 약관을 참조하세요.