📊 Key Technical Indicators
Relative Strength Index (RSI): Approximately 58.89, indicating a neutral to bullish momentum.
Moving Average Convergence Divergence (MACD): Around 0.58, suggesting a bullish trend.
Simple Moving Averages (SMA):
5-Day: ₹179.11
50-Day: ₹177.17
200-Day: ₹177.3
These values indicate a bullish sentiment, as the stock is trading above these averages.
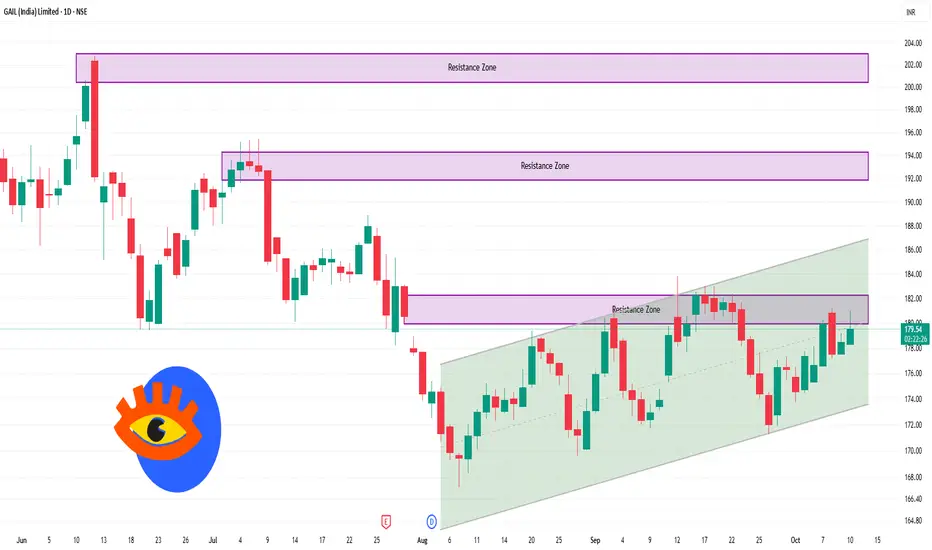
📈 Support and Resistance Levels
Immediate Support: ₹177.20
Immediate Resistance: ₹182.50
A breakout above ₹182.50 could signal a continuation of the uptrend, while a fall below ₹177.20 might indicate a bearish reversal.
🧭 Summary
GAIL (India) Ltd. is currently in a neutral to bullish phase on the daily chart. Key indicators like RSI and MACD support this outlook, and the ascending triangle pattern suggests potential upward momentum. However, traders should monitor the support and resistance levels closely to assess the next move.
Relative Strength Index (RSI): Approximately 58.89, indicating a neutral to bullish momentum.
Moving Average Convergence Divergence (MACD): Around 0.58, suggesting a bullish trend.
Simple Moving Averages (SMA):
5-Day: ₹179.11
50-Day: ₹177.17
200-Day: ₹177.3
These values indicate a bullish sentiment, as the stock is trading above these averages.
📈 Support and Resistance Levels
Immediate Support: ₹177.20
Immediate Resistance: ₹182.50
A breakout above ₹182.50 could signal a continuation of the uptrend, while a fall below ₹177.20 might indicate a bearish reversal.
🧭 Summary
GAIL (India) Ltd. is currently in a neutral to bullish phase on the daily chart. Key indicators like RSI and MACD support this outlook, and the ascending triangle pattern suggests potential upward momentum. However, traders should monitor the support and resistance levels closely to assess the next move.
관련 발행물
면책사항
이 정보와 게시물은 TradingView에서 제공하거나 보증하는 금융, 투자, 거래 또는 기타 유형의 조언이나 권고 사항을 의미하거나 구성하지 않습니다. 자세한 내용은 이용 약관을 참고하세요.
관련 발행물
면책사항
이 정보와 게시물은 TradingView에서 제공하거나 보증하는 금융, 투자, 거래 또는 기타 유형의 조언이나 권고 사항을 의미하거나 구성하지 않습니다. 자세한 내용은 이용 약관을 참고하세요.