롱
Footsie Price action buy setup
Hi Traders,
FTSE 100 (Footsie) has caught my attention today. The instrument has now displayed Signs of moving to the upside. When looking at the higher timeframe, Price has now created a strong bullish candle on the daily, If price does manage to close this way It will be the very first sign that we have some actual bulls coming into play.
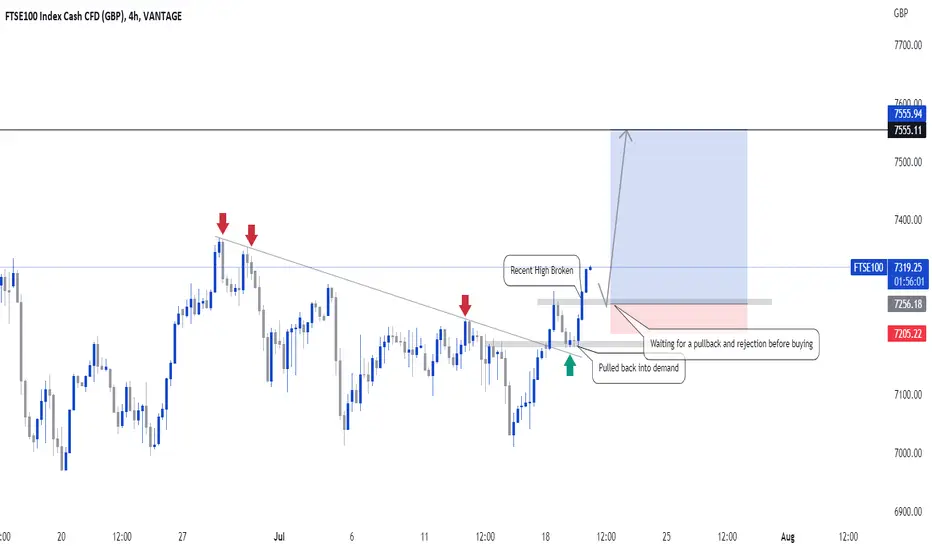
I then will be analyzing the four-hour timeframe where I have mapped out a descending trend line that has been broken. With this being said the TL has also retested the trend line as well as a demand zone as mapped out in the chart. After the retest of the demand zone price then proceeds to create a new higher high taking out a recent high which signifies a shift in structure now.
My plan of action on this one is more conservative as I would love to see a pullback take place, but, remember we need to wait for the daily candle to close bullish. If price does manage to pull back tomorrow I will be waiting for a retest and then a rejection of the resistance at 7250.
My Target is placed at 7555 which seems to have clear and clean traffic with a high probability of hitting.
Once again, wait for the daily candle to close.
Renaldo Philander
FTSE 100 (Footsie) has caught my attention today. The instrument has now displayed Signs of moving to the upside. When looking at the higher timeframe, Price has now created a strong bullish candle on the daily, If price does manage to close this way It will be the very first sign that we have some actual bulls coming into play.
I then will be analyzing the four-hour timeframe where I have mapped out a descending trend line that has been broken. With this being said the TL has also retested the trend line as well as a demand zone as mapped out in the chart. After the retest of the demand zone price then proceeds to create a new higher high taking out a recent high which signifies a shift in structure now.
My plan of action on this one is more conservative as I would love to see a pullback take place, but, remember we need to wait for the daily candle to close bullish. If price does manage to pull back tomorrow I will be waiting for a retest and then a rejection of the resistance at 7250.
My Target is placed at 7555 which seems to have clear and clean traffic with a high probability of hitting.
Once again, wait for the daily candle to close.
Renaldo Philander
면책사항
이 정보와 게시물은 TradingView에서 제공하거나 보증하는 금융, 투자, 거래 또는 기타 유형의 조언이나 권고 사항을 의미하거나 구성하지 않습니다. 자세한 내용은 이용 약관을 참고하세요.
면책사항
이 정보와 게시물은 TradingView에서 제공하거나 보증하는 금융, 투자, 거래 또는 기타 유형의 조언이나 권고 사항을 의미하거나 구성하지 않습니다. 자세한 내용은 이용 약관을 참고하세요.