FTM is in Danger of Testing Much Lower Price Ranges
FTM chart is not looking very good in the near term.
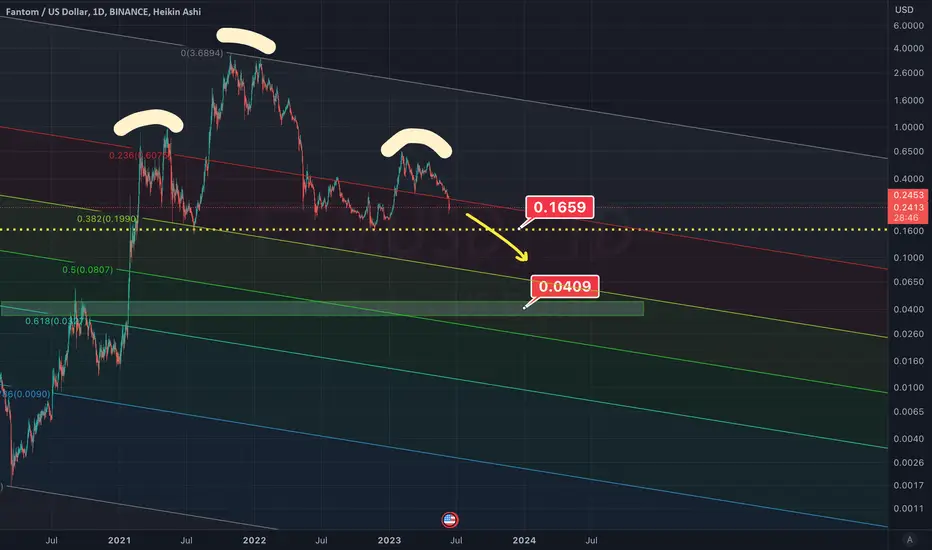
If FTM breaks below 0.20 level, it could accelerate down to 0.04 level which is aligned with the 0.618 golden pocket.
FTM is also forming a head and shoulders pattern and if it breaks the neck line of 0.1660 the price target for that is also right below 0.04.
If FTM breaks below 0.20 level, it could accelerate down to 0.04 level which is aligned with the 0.618 golden pocket.
FTM is also forming a head and shoulders pattern and if it breaks the neck line of 0.1660 the price target for that is also right below 0.04.
E.O. Breakers
@cryptowhenlambo
linktr.ee/cryptobreakers
patreon.com/CryptoWhenLambo
@cryptowhenlambo
linktr.ee/cryptobreakers
patreon.com/CryptoWhenLambo
면책사항
해당 정보와 게시물은 금융, 투자, 트레이딩 또는 기타 유형의 조언이나 권장 사항으로 간주되지 않으며, 트레이딩뷰에서 제공하거나 보증하는 것이 아닙니다. 자세한 내용은 이용 약관을 참조하세요.
E.O. Breakers
@cryptowhenlambo
linktr.ee/cryptobreakers
patreon.com/CryptoWhenLambo
@cryptowhenlambo
linktr.ee/cryptobreakers
patreon.com/CryptoWhenLambo
면책사항
해당 정보와 게시물은 금융, 투자, 트레이딩 또는 기타 유형의 조언이나 권장 사항으로 간주되지 않으며, 트레이딩뷰에서 제공하거나 보증하는 것이 아닙니다. 자세한 내용은 이용 약관을 참조하세요.