업데이트됨
FSR breaks out of Descending Triangle LONG
$NYSE:FSR
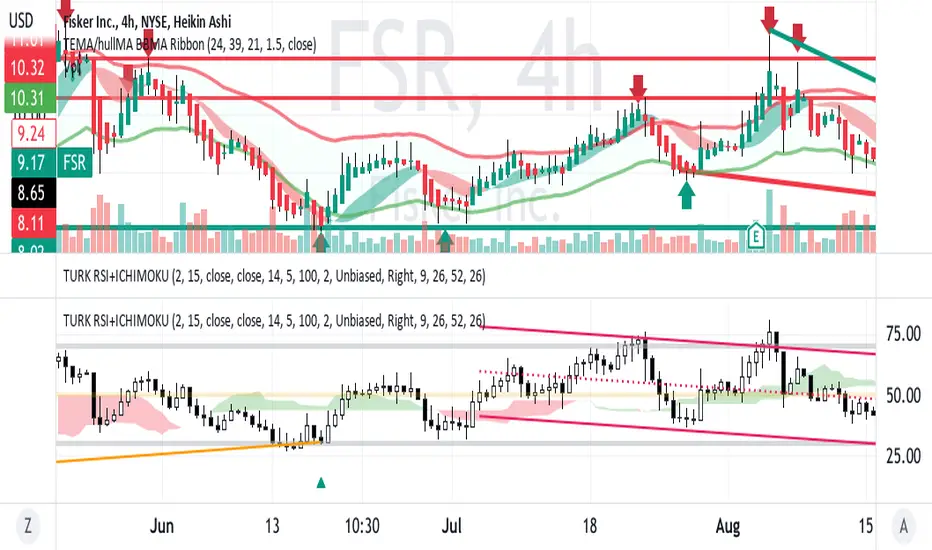
On the 4H chart with trendlines drawn FSR is trending up out of the triangle.
The RSI with Ichimoku indicator shows the confirmatory increasing relative strength
in a move from under to over the cloud.
All in all, this appears to be a swing long set up with a near upside of 20 %
or about $12 .
On the 4H chart with trendlines drawn FSR is trending up out of the triangle.
The RSI with Ichimoku indicator shows the confirmatory increasing relative strength
in a move from under to over the cloud.
All in all, this appears to be a swing long set up with a near upside of 20 %
or about $12 .
액티브 트레이드
FSR had a nice 3% jump with a bullish candle after a doji showing buyers are taking trades.면책사항
해당 정보와 게시물은 금융, 투자, 트레이딩 또는 기타 유형의 조언이나 권장 사항으로 간주되지 않으며, 트레이딩뷰에서 제공하거나 보증하는 것이 아닙니다. 자세한 내용은 이용 약관을 참조하세요.
면책사항
해당 정보와 게시물은 금융, 투자, 트레이딩 또는 기타 유형의 조언이나 권장 사항으로 간주되지 않으며, 트레이딩뷰에서 제공하거나 보증하는 것이 아닙니다. 자세한 내용은 이용 약관을 참조하세요.