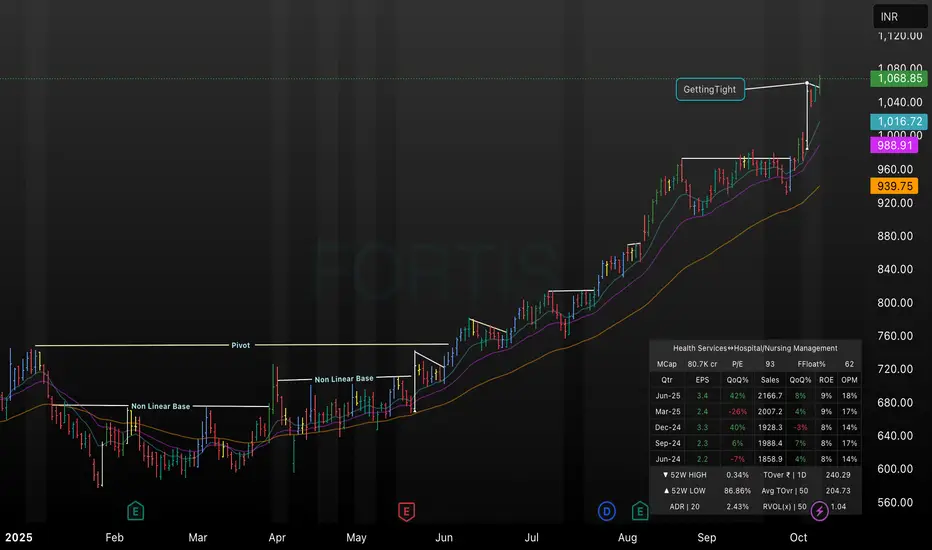
This TradingView daily chart for Fortis (2025) illustrates key technical setups including two clearly labeled non-linear base formations, a major pivot breakout, and subsequent price consolidation zones. The chart captures the transition from range-bound action to a strong bullish move, highlighting the “Getting Tight” pattern before this recent surge. Additional metrics such as moving averages, volume overlays, and stock fundamentals are visible, providing a comprehensive overview for swing or positional traders seeking technical clarity.
면책사항
이 정보와 게시물은 TradingView에서 제공하거나 보증하는 금융, 투자, 거래 또는 기타 유형의 조언이나 권고 사항을 의미하거나 구성하지 않습니다. 자세한 내용은 이용 약관을 참고하세요.
면책사항
이 정보와 게시물은 TradingView에서 제공하거나 보증하는 금융, 투자, 거래 또는 기타 유형의 조언이나 권고 사항을 의미하거나 구성하지 않습니다. 자세한 내용은 이용 약관을 참고하세요.