롱
FIRO to $110
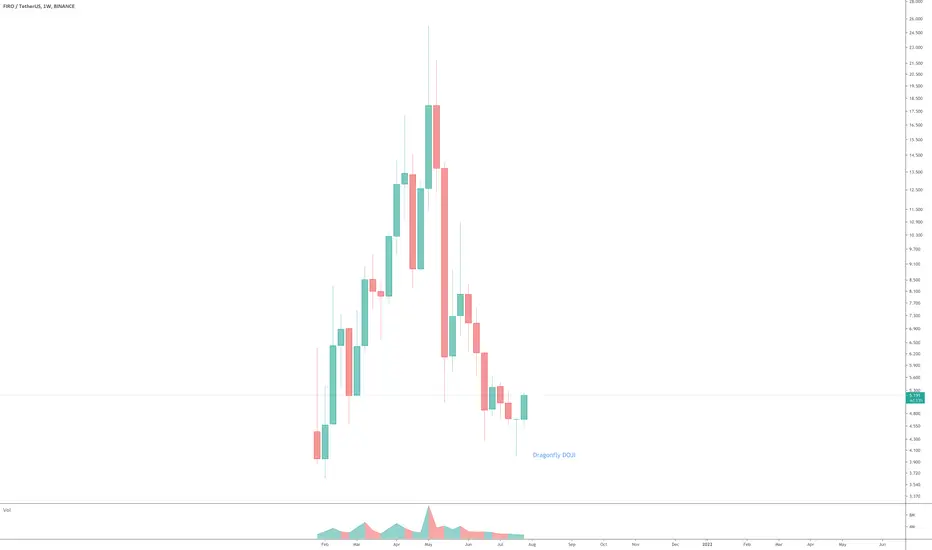
On the above weekly chart after a 80% correction price action prints a textbook Dragonfly DOJI candle. This is a strong signal following the sell off a reversal of equal momentum is about to occur.
On the daily chart below price action breaks out of resistance following the bullish divergence.

Why $110?
FIRO is actually Zcoin, it was rebranded. Price action history for FIRO is limited. However with a bit of trickery, and hey presto - Firo/zcoin complete history on weekly:

On the daily chart below price action breaks out of resistance following the bullish divergence.
Why $110?
FIRO is actually Zcoin, it was rebranded. Price action history for FIRO is limited. However with a bit of trickery, and hey presto - Firo/zcoin complete history on weekly:
액티브 트레이드
액티브 트레이드
노트
Got to love the power behind those DOJIs. Next near term target $12. Expect resistance around here, this level has history.액티브 트레이드
Price action breaks out of $7.94 resistance area. Next target is around $21노트
Significant price action breaks through of the 21-week EMA and 50-week EMA on the weekly chart.액티브 트레이드
2-day golden crossWhat? What's that? The talk of the town at the moment is golden crosses appearing on a number of 1-day charts, including BTC. But is it meaningful as previous crosses? That's where 2-day chart comes in.
Those crosses are particularly powerful on the 2-day chart. I think it was Steve from crypto crew university that first made me aware of those crosses. Essentially it is the same as the 50-day EMA crossing up the 200-day EMA on a 1-day chart, but on a 2-day chart it is really 100-EMA crossing up the 400-day EMA. A lot of day to day noise is removed resulting in a very powerful method to identify if a bull or bear market condition is true.
액티브 트레이드
Don't chase it...노트
The weekly is looking very nice indeed, bullish engulfing candle on the weekly close and on the 21-week EMA. Stay long. 노트
Price action remains in a consolidation band. An attempt at target will not be realised until price action breaks out above $13 resistance area.On the 4-day chart below price action has recently broken out of price action resistance follow by a higher low. Stochastic RSI has also recently crossed up 20, this is good.
Patient is everything.
노트
Price action is one the move with this one, no idea why.노트
300% in a few hours. Can someone tell me why?Crazy alt-season is here.
액티브 트레이드
Can't give this one a high score.. and I've no interest perhaps someone else does.The conditions that existed prior to the last move in the previous update exist today. Patrons, refer to the power of divergence post.
노트
See daily chart below. Nudge nudge wink wink with nobs on.액티브 트레이드
GRM support confirmed. Can't be bother writing a new idea!면책사항
이 정보와 게시물은 TradingView에서 제공하거나 보증하는 금융, 투자, 거래 또는 기타 유형의 조언이나 권고 사항을 의미하거나 구성하지 않습니다. 자세한 내용은 이용 약관을 참고하세요.
면책사항
이 정보와 게시물은 TradingView에서 제공하거나 보증하는 금융, 투자, 거래 또는 기타 유형의 조언이나 권고 사항을 의미하거나 구성하지 않습니다. 자세한 내용은 이용 약관을 참고하세요.