📊 Technical Analysis Summary – FIL/USDT
🔸 Pattern Observed:
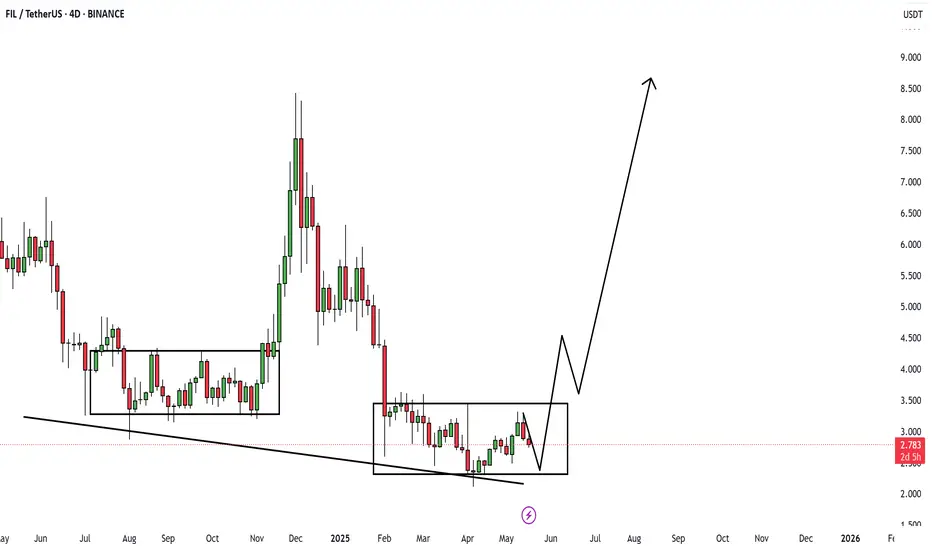
Double Accumulation Range: Two clear consolidation phases are boxed out in the chart, showing accumulation at relatively equal support zones.
Descending Support Line: The lower black trendline connects the major lows, creating a descending support structure, indicating compression and possible breakout setup.
🔸 Price Action:
Current Price: $2.787
Pullback Expected: A minor dip within the current range is possible before a breakout.
Projected Move: If this consolidation resolves bullishly, the projected target appears to be in the $8–$9 range, aligning with the black arrow on the chart.
📈 Bullish Scenario (Likely Path)
Retest support near $2.5–$2.6
Breakout trigger on move above ~$3.2–$3.4
Target zone = $8–$9 (from measured move potential)
⚠️ Key Levels to Watch
Support: $2.50 (critical zone for accumulation)
Resistance to break: ~$3.30–$3.50
Macro Target: $8.50+
✅ Conclusion:
This chart shows a potential reversal from a prolonged downtrend, where the price is forming a classic reversal structure. Patience is key—a breakout above $3.5 would confirm the bullish move.
Subscribe to my Telegram Channel 👉 :
t.me/addlist/y5mi70s3c0Y3MDQ0
Subscribe to my X 👉 : x.com/VIPROSETR
t.me/addlist/y5mi70s3c0Y3MDQ0
Subscribe to my X 👉 : x.com/VIPROSETR
면책사항
이 정보와 게시물은 TradingView에서 제공하거나 보증하는 금융, 투자, 거래 또는 기타 유형의 조언이나 권고 사항을 의미하거나 구성하지 않습니다. 자세한 내용은 이용 약관을 참고하세요.
Subscribe to my Telegram Channel 👉 :
t.me/addlist/y5mi70s3c0Y3MDQ0
Subscribe to my X 👉 : x.com/VIPROSETR
t.me/addlist/y5mi70s3c0Y3MDQ0
Subscribe to my X 👉 : x.com/VIPROSETR
면책사항
이 정보와 게시물은 TradingView에서 제공하거나 보증하는 금융, 투자, 거래 또는 기타 유형의 조언이나 권고 사항을 의미하거나 구성하지 않습니다. 자세한 내용은 이용 약관을 참고하세요.