Analysis:
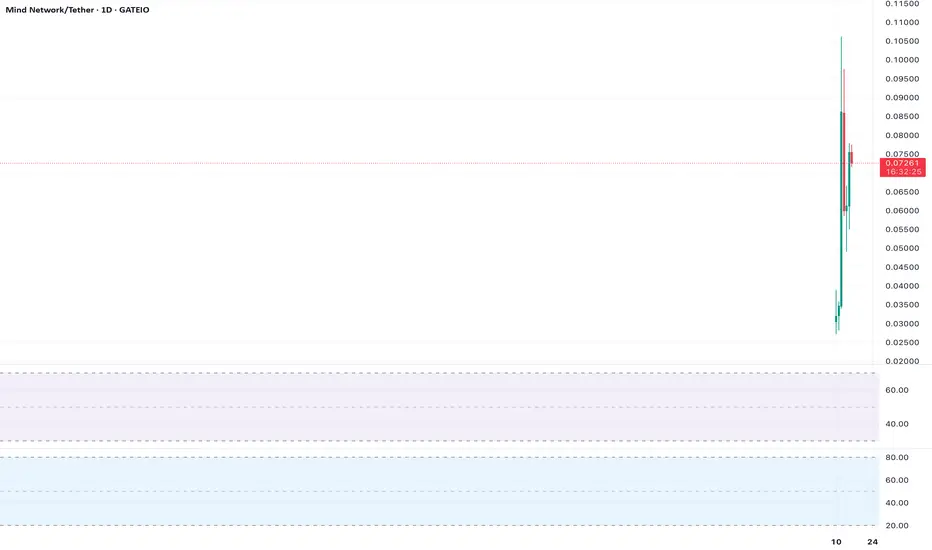
 FHE’s daily chart shows a potential double bottom at $0.00000075, a bullish pattern. The price is at $0.00000079, with RSI rising from oversold levels (30). A move above $0.00000085 confirms the pattern, targeting $0.0000011. Low volume is a risk.
Actionable Insight:
Long on a break above $0.00000085, targeting $0.0000011. Stop-loss at $0.00000074. Confirm with volume before entry.
Chart Setup:
Timeframe: Daily
Indicators: RSI, Double Bottom
Levels: Neckline ($0.00000085), Target ($0.0000011)
Actionable Insight:
Long on a break above $0.00000085, targeting $0.0000011. Stop-loss at $0.00000074. Confirm with volume before entry.
Chart Setup:
Timeframe: Daily
Indicators: RSI, Double Bottom
Levels: Neckline ($0.00000085), Target ($0.0000011)
면책사항
이 정보와 게시물은 TradingView에서 제공하거나 보증하는 금융, 투자, 거래 또는 기타 유형의 조언이나 권고 사항을 의미하거나 구성하지 않습니다. 자세한 내용은 이용 약관을 참고하세요.
면책사항
이 정보와 게시물은 TradingView에서 제공하거나 보증하는 금융, 투자, 거래 또는 기타 유형의 조언이나 권고 사항을 의미하거나 구성하지 않습니다. 자세한 내용은 이용 약관을 참고하세요.