Actionable Insight:
Wait for a daily close above $0.00000078 for a long entry, targeting $0.0000010. Stop-loss at $0.00000075. Avoid trading if volume doesn’t pick up.
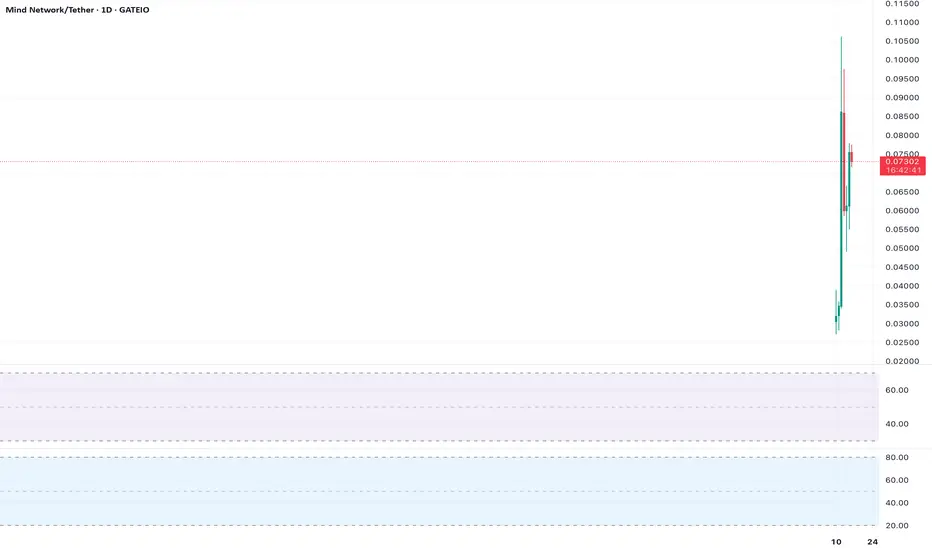
Chart Setup:
Timeframe: Daily
Indicators: 200-day EMA, RSI
Levels: Support ($0.00000078), Target ($0.0000010)
면책사항
이 정보와 게시물은 TradingView에서 제공하거나 보증하는 금융, 투자, 거래 또는 기타 유형의 조언이나 권고 사항을 의미하거나 구성하지 않습니다. 자세한 내용은 이용 약관을 참고하세요.
면책사항
이 정보와 게시물은 TradingView에서 제공하거나 보증하는 금융, 투자, 거래 또는 기타 유형의 조언이나 권고 사항을 의미하거나 구성하지 않습니다. 자세한 내용은 이용 약관을 참고하세요.