Fetch.ai (FET) Chart Analysis: Observing a Bullish Pennant Break
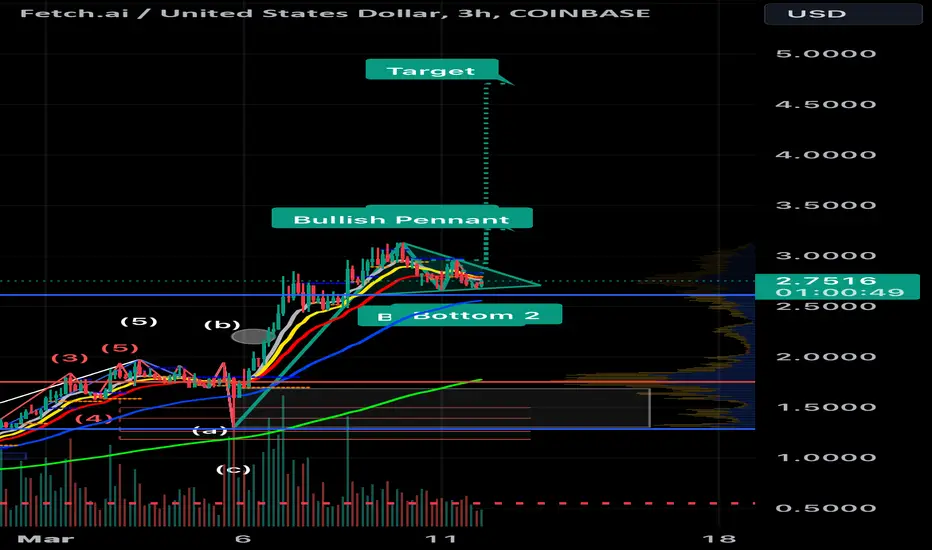
The FET/USD 3-hour chart displays a pattern resembling a bullish pennant breakout. If this breakout is confirmed, technical analysis suggests a potential price target of $4.71.
액티브 트레이드
노트
Sometimes patterns morph into new patterns노트
New pattern same target노트
노트
노트
Another new ATH노트
Agix and ocean are planning to merge with FetchAi.노트
노트
Bull markets are fun. Its meme and AI season.노트
액티브 트레이드
노트
There is lots of fud coming out regarding the agix, ocean, fetchai token consolidation. I’m just gonna double down on fet at the equilibrium around $2 if it falls there.노트
노트
I just can’t see a big correction just yet.액티브 트레이드
액티브 트레이드
노트
Stop loss at $2.79.거래청산: 스탑 닿음
액티브 트레이드
Strong bullish divergence on all time framesUSDT: 0xd3787d843Cf915E5475119459B34b6429827c297
면책사항
이 정보와 게시물은 TradingView에서 제공하거나 보증하는 금융, 투자, 거래 또는 기타 유형의 조언이나 권고 사항을 의미하거나 구성하지 않습니다. 자세한 내용은 이용 약관을 참고하세요.
USDT: 0xd3787d843Cf915E5475119459B34b6429827c297
면책사항
이 정보와 게시물은 TradingView에서 제공하거나 보증하는 금융, 투자, 거래 또는 기타 유형의 조언이나 권고 사항을 의미하거나 구성하지 않습니다. 자세한 내용은 이용 약관을 참고하세요.