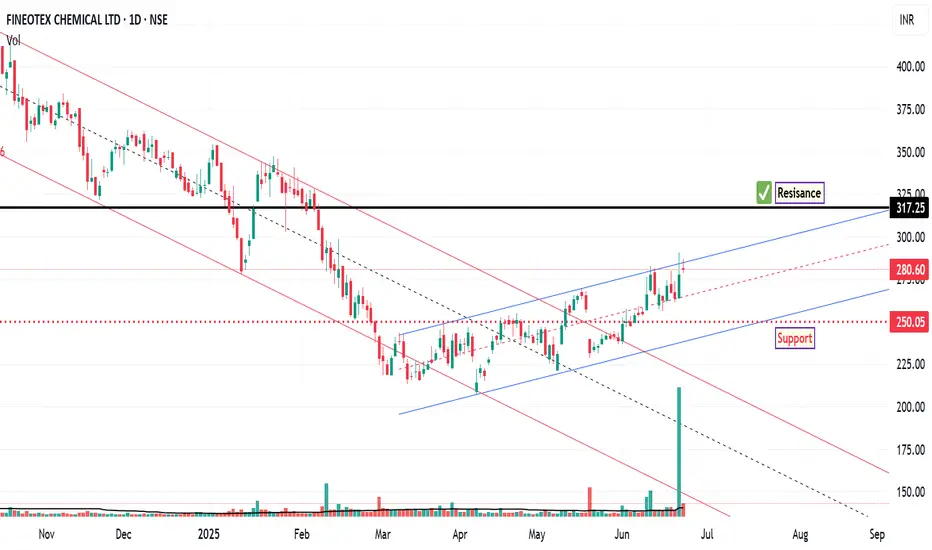
The chart of FCL outlines key price levels that represent potential breakout zones, signaling shifts in market momentum. It also identifies critical support areas where buying interest may emerge, offering insight into potential entry points.
Additionally, resistance zones are clearly marked, indicating probable barriers to upward price movement. These levels are instrumental in formulating strategic entry and exit decisions based on anticipated market behaviour.
Disclaimer:
This technical analysis is provided for informational and educational purposes only. It does not constitute financial advice or a recommendation to buy or sell any security. Investors should perform their own due diligence and consult with a licensed financial advisor before making any investment decisions.
거래청산: 스탑 닿음
Setup Invalid, Trade Close면책사항
해당 정보와 게시물은 금융, 투자, 트레이딩 또는 기타 유형의 조언이나 권장 사항으로 간주되지 않으며, 트레이딩뷰에서 제공하거나 보증하는 것이 아닙니다. 자세한 내용은 이용 약관을 참조하세요.
면책사항
해당 정보와 게시물은 금융, 투자, 트레이딩 또는 기타 유형의 조언이나 권장 사항으로 간주되지 않으며, 트레이딩뷰에서 제공하거나 보증하는 것이 아닙니다. 자세한 내용은 이용 약관을 참조하세요.