Analysis on FB Inc, US as 5 june 2020
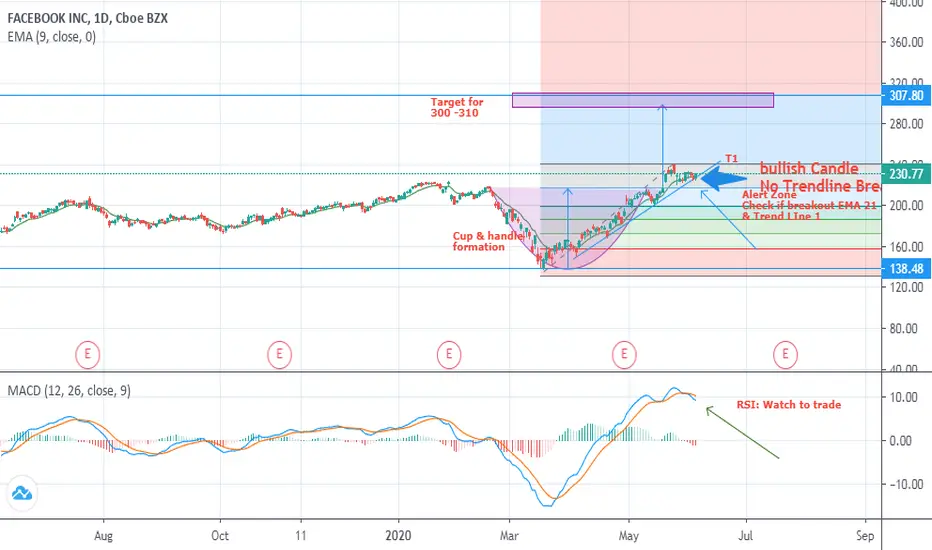
Chart Patterns: Cup & Handle Formation indicating next targe to $300 - 310
Candle: bullish Candle No Trendline Breakout as per 5 june candle
Alert Zone, Check if breakout EMA 21 & Trend LIne 1
RSI: Watch to trade Trend ; Sideway, Watch to trade
Candle: bullish Candle No Trendline Breakout as per 5 june candle
Alert Zone, Check if breakout EMA 21 & Trend LIne 1
RSI: Watch to trade Trend ; Sideway, Watch to trade
면책사항
이 정보와 게시물은 TradingView에서 제공하거나 보증하는 금융, 투자, 거래 또는 기타 유형의 조언이나 권고 사항을 의미하거나 구성하지 않습니다. 자세한 내용은 이용 약관을 참고하세요.
면책사항
이 정보와 게시물은 TradingView에서 제공하거나 보증하는 금융, 투자, 거래 또는 기타 유형의 조언이나 권고 사항을 의미하거나 구성하지 않습니다. 자세한 내용은 이용 약관을 참고하세요.