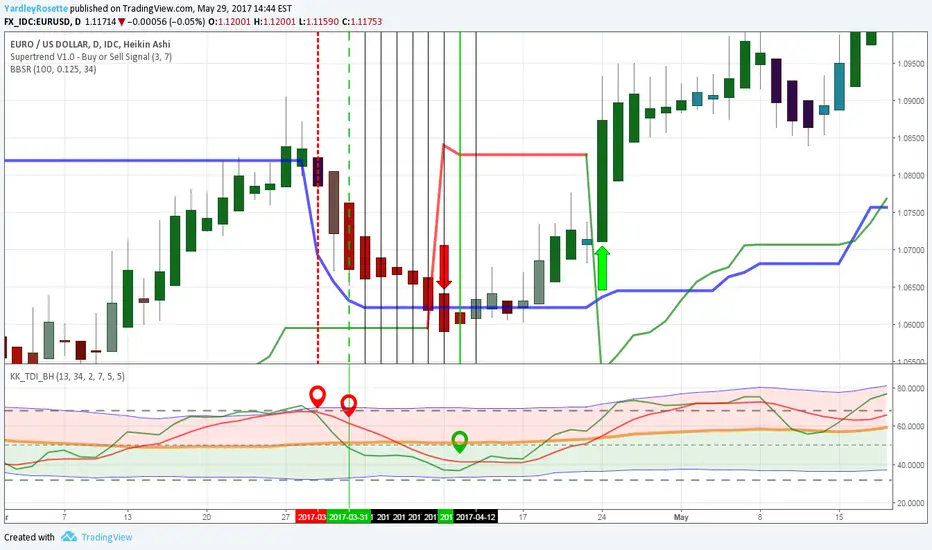
RSI/TSI cross down signal ocurred.
RSI/TSI remains bearish, though 1H Dynamic Index indication, simple/generic buy entry conditions/rules of:
RSI/TSI having been oversold, MBL risen from near 32, & RSI/TSI cross MBL up & RSI to cross above Volatility Band High were met.
Lower Time Frames indicate bullish movement within Daily chart.
Daily chart RSI/TSI cross up follows, bullish trend>>
면책사항
이 정보와 게시물은 TradingView에서 제공하거나 보증하는 금융, 투자, 거래 또는 기타 유형의 조언이나 권고 사항을 의미하거나 구성하지 않습니다. 자세한 내용은 이용 약관을 참고하세요.
면책사항
이 정보와 게시물은 TradingView에서 제공하거나 보증하는 금융, 투자, 거래 또는 기타 유형의 조언이나 권고 사항을 의미하거나 구성하지 않습니다. 자세한 내용은 이용 약관을 참고하세요.