📍 To see my confluences and/or linework, step 1: grab chart, step 2: unhide Group 1 in object tree, step 3: hide and unhide specific confluences. 😊
🔥 EUR/NOK: Bulls Spring-Loaded After Bears Exhausted at Key Support
The Market Participant Battle:
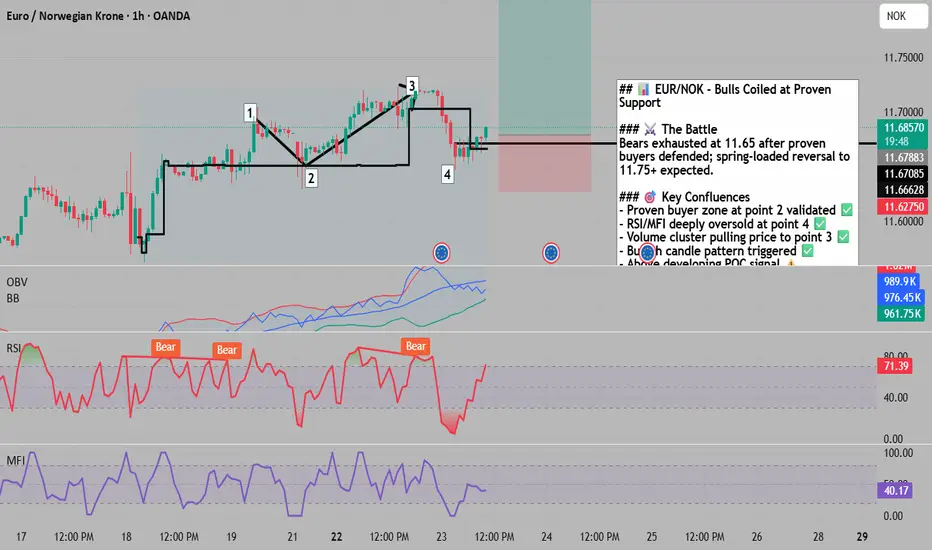
Bears have been systematically beaten at the 11.64-11.67 resistance zone (marked as points 1 and 3 on the chart), with bulls proving their strength at the crucial 11.65 support level (point 2). This pattern creates a classic "bears trapped high, bulls defended low" setup where exhausted sellers at point 4 are facing a spring-loaded bullish reversal. The oversold RSI and MFI conditions at point 4, combined with strong volume clustering near point 3, suggests bears have capitulated and price should return upward toward the 11.70-11.75 zone as buyers regain control.
Confluences:
Confluence 1: Proven Buyer Zone at Point 2
The chart clearly shows point 2 acting as a magnetic support level where institutional buyers defended aggressively. When point 3 closed above point 1's high, it validated point 2 as a "proven market participant zone" - essentially confirming that smart money accumulated positions here. Now at point 4, we're returning to these same proven buyers who should defend their positions again, creating a high-probability bounce setup.
Confluence 2: Technical Indicator Alignment
Both RSI and MFI indicators show deep oversold conditions at point 4, creating a powerful mean reversion signal. The RSI has been in bearish territory through multiple cycles, suggesting bears are exhausted. Additionally, a bullish candle pattern emerged when a green candle closed above the previous candle's high - this is the classic trade trigger signaling buyer strength returning.
Confluence 3: Volume Profile & POC Dynamics
The anchored volume profile reveals the closest major volume cluster sits at point 3, acting as a magnet pulling price upward. Point 4 shows price moving above the developing Point of Control (POC) after being under it, indicating a shift in market structure. This volume-based analysis confirms buyers are stepping in at these levels with conviction.
Web Research Findings:
- Technical Analysis: Multiple analysts show EUR/NOK in a downtrend channel from 12.00 to 11.55, with current support at 11.54-11.60 confirming our point 4 setup
- Recent News/Earnings: Norges Bank delivered a hawkish rate cut to 4.0% on September 18, 2025, signaling slower easing ahead - initially bearish but now priced in
- Analyst Sentiment: TradingView consensus shows "Strong Sell" on shorter timeframes but forecasts suggest 11.57-12.43 range by year-end 2025
- Data Releases & Economic Calendar: Norway's strong Q2 GDP (0.6% vs 0.3% expected) and persistent 3.1% core inflation support NOK, but oil weakness at $66/barrel creates headwinds
- Interest Rate Impact: EUR rates expected to fall faster than NOK rates, creating a narrowing differential that should eventually favor EUR/NOK upside
Layman's Summary:
Think of this like a tug-of-war where the bears (sellers) pulled hard but got tired at specific price levels. The recent Norges Bank decision was like adding weight to the NOK side temporarily, but with oil prices weak and Europe potentially cutting rates slower than expected, the EUR side is about to pull back. The technical indicators are like energy meters showing the bears are exhausted (oversold), while volume patterns show big buyers waiting at current levels. This creates a spring-loaded setup where a bounce becomes highly probable.
Machine Derived Information:
- Image 1: EUR/NOK hourly chart with numbered pivot points - Significance: Shows clear 1-2-3-4 pattern formation - AGREES ✔
- Image 2: Same setup with technical indicators - Significance: RSI and MFI deeply oversold at point 4, volume profile confirms support - AGREES ✔
- Image 3: Fibonacci retracement overlay - Significance: Point 4 respecting 61.8% Fibonacci level near 11.66-11.67 - AGREES ✔
- Image 4: Extended Fibonacci view - Significance: Confirms same support zones with volume concentration - AGREES ✔
- Image 5: MSFT comparison chart - Significance: Different asset showing similar pattern structure - NEUTRAL ⚠️
- Image 6: MSFT duplicate - Significance: Same as Image 5 - NEUTRAL ⚠️
Actionable Machine Summary:
All chart analyses confirm the primary thesis: bears are exhausted at point 4 after failing to break below the proven buyer zone at point 2. The oversold technical indicators combined with bullish candle patterns and volume support create a high-conviction long setup. The Fibonacci levels provide additional confirmation with the 61.8% retracement acting as support.
Conclusion:
Trade Prediction: SUCCESS ✅
Confidence: High
The confluence of proven buyer support, deeply oversold conditions, volume profile dynamics, and completed pattern structure creates a compelling bullish setup. While fundamental headwinds from Norway's hawkish central bank stance exist, the technical picture suggests these are already priced in. The risk/reward favors longs from current levels with stops below 11.60 and targets at 11.75-11.80.
🔥 EUR/NOK: Bulls Spring-Loaded After Bears Exhausted at Key Support
The Market Participant Battle:
Bears have been systematically beaten at the 11.64-11.67 resistance zone (marked as points 1 and 3 on the chart), with bulls proving their strength at the crucial 11.65 support level (point 2). This pattern creates a classic "bears trapped high, bulls defended low" setup where exhausted sellers at point 4 are facing a spring-loaded bullish reversal. The oversold RSI and MFI conditions at point 4, combined with strong volume clustering near point 3, suggests bears have capitulated and price should return upward toward the 11.70-11.75 zone as buyers regain control.
Confluences:
Confluence 1: Proven Buyer Zone at Point 2
The chart clearly shows point 2 acting as a magnetic support level where institutional buyers defended aggressively. When point 3 closed above point 1's high, it validated point 2 as a "proven market participant zone" - essentially confirming that smart money accumulated positions here. Now at point 4, we're returning to these same proven buyers who should defend their positions again, creating a high-probability bounce setup.
Confluence 2: Technical Indicator Alignment
Both RSI and MFI indicators show deep oversold conditions at point 4, creating a powerful mean reversion signal. The RSI has been in bearish territory through multiple cycles, suggesting bears are exhausted. Additionally, a bullish candle pattern emerged when a green candle closed above the previous candle's high - this is the classic trade trigger signaling buyer strength returning.
Confluence 3: Volume Profile & POC Dynamics
The anchored volume profile reveals the closest major volume cluster sits at point 3, acting as a magnet pulling price upward. Point 4 shows price moving above the developing Point of Control (POC) after being under it, indicating a shift in market structure. This volume-based analysis confirms buyers are stepping in at these levels with conviction.
Web Research Findings:
- Technical Analysis: Multiple analysts show EUR/NOK in a downtrend channel from 12.00 to 11.55, with current support at 11.54-11.60 confirming our point 4 setup
- Recent News/Earnings: Norges Bank delivered a hawkish rate cut to 4.0% on September 18, 2025, signaling slower easing ahead - initially bearish but now priced in
- Analyst Sentiment: TradingView consensus shows "Strong Sell" on shorter timeframes but forecasts suggest 11.57-12.43 range by year-end 2025
- Data Releases & Economic Calendar: Norway's strong Q2 GDP (0.6% vs 0.3% expected) and persistent 3.1% core inflation support NOK, but oil weakness at $66/barrel creates headwinds
- Interest Rate Impact: EUR rates expected to fall faster than NOK rates, creating a narrowing differential that should eventually favor EUR/NOK upside
Layman's Summary:
Think of this like a tug-of-war where the bears (sellers) pulled hard but got tired at specific price levels. The recent Norges Bank decision was like adding weight to the NOK side temporarily, but with oil prices weak and Europe potentially cutting rates slower than expected, the EUR side is about to pull back. The technical indicators are like energy meters showing the bears are exhausted (oversold), while volume patterns show big buyers waiting at current levels. This creates a spring-loaded setup where a bounce becomes highly probable.
Machine Derived Information:
- Image 1: EUR/NOK hourly chart with numbered pivot points - Significance: Shows clear 1-2-3-4 pattern formation - AGREES ✔
- Image 2: Same setup with technical indicators - Significance: RSI and MFI deeply oversold at point 4, volume profile confirms support - AGREES ✔
- Image 3: Fibonacci retracement overlay - Significance: Point 4 respecting 61.8% Fibonacci level near 11.66-11.67 - AGREES ✔
- Image 4: Extended Fibonacci view - Significance: Confirms same support zones with volume concentration - AGREES ✔
- Image 5: MSFT comparison chart - Significance: Different asset showing similar pattern structure - NEUTRAL ⚠️
- Image 6: MSFT duplicate - Significance: Same as Image 5 - NEUTRAL ⚠️
Actionable Machine Summary:
All chart analyses confirm the primary thesis: bears are exhausted at point 4 after failing to break below the proven buyer zone at point 2. The oversold technical indicators combined with bullish candle patterns and volume support create a high-conviction long setup. The Fibonacci levels provide additional confirmation with the 61.8% retracement acting as support.
Conclusion:
Trade Prediction: SUCCESS ✅
Confidence: High
The confluence of proven buyer support, deeply oversold conditions, volume profile dynamics, and completed pattern structure creates a compelling bullish setup. While fundamental headwinds from Norway's hawkish central bank stance exist, the technical picture suggests these are already priced in. The risk/reward favors longs from current levels with stops below 11.60 and targets at 11.75-11.80.
for trading mentorship and community, message me on telegram : jacesabr_real
면책사항
이 정보와 게시물은 TradingView에서 제공하거나 보증하는 금융, 투자, 거래 또는 기타 유형의 조언이나 권고 사항을 의미하거나 구성하지 않습니다. 자세한 내용은 이용 약관을 참고하세요.
for trading mentorship and community, message me on telegram : jacesabr_real
면책사항
이 정보와 게시물은 TradingView에서 제공하거나 보증하는 금융, 투자, 거래 또는 기타 유형의 조언이나 권고 사항을 의미하거나 구성하지 않습니다. 자세한 내용은 이용 약관을 참고하세요.