Technical Analysis Of EURCAD
1. Current Market Structure
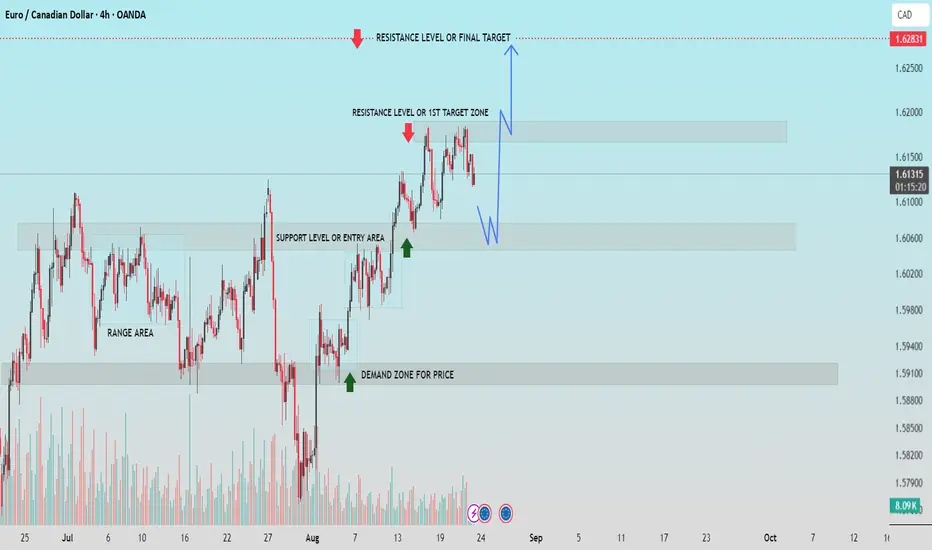
EUR/CAD is trading around 1.6135, consolidating just below the first resistance zone (1.6180). Price has previously broken out from a range and is now in a bullish structure with higher highs and higher lows.
2. Key Support & Demand Zones
* Support Area: Around 1.6060, which acted as an entry area after the breakout.
* Demand Zone: Near 1.5910, where strong buying previously occurred, making it a critical level if deeper pullback happens.
3. Resistance Levels & Targets
* First Resistance / Target Zone: 1.6180, immediate hurdle for bulls.
* Final Resistance / Target: 1.6280, the ultimate bullish target if price maintains upward momentum.
4. Possible Price Scenarios
* Bullish Outlook: If price pulls back to 1.6060 and shows bullish confirmation, we can expect a move towards 1.6180, and eventually 1.6280.
* Bearish Outlook: A break below 1.6060 opens the door for a correction towards 1.5910.
5. Trading Plan
* Bias: Bullish above 1.6060.
* Strategy: Wait for pullback and bullish price action near support before entering long positions. Avoid chasing entries at resistance.
If this helpful for you, press the like button.
1. Current Market Structure
EUR/CAD is trading around 1.6135, consolidating just below the first resistance zone (1.6180). Price has previously broken out from a range and is now in a bullish structure with higher highs and higher lows.
2. Key Support & Demand Zones
* Support Area: Around 1.6060, which acted as an entry area after the breakout.
* Demand Zone: Near 1.5910, where strong buying previously occurred, making it a critical level if deeper pullback happens.
3. Resistance Levels & Targets
* First Resistance / Target Zone: 1.6180, immediate hurdle for bulls.
* Final Resistance / Target: 1.6280, the ultimate bullish target if price maintains upward momentum.
4. Possible Price Scenarios
* Bullish Outlook: If price pulls back to 1.6060 and shows bullish confirmation, we can expect a move towards 1.6180, and eventually 1.6280.
* Bearish Outlook: A break below 1.6060 opens the door for a correction towards 1.5910.
5. Trading Plan
* Bias: Bullish above 1.6060.
* Strategy: Wait for pullback and bullish price action near support before entering long positions. Avoid chasing entries at resistance.
If this helpful for you, press the like button.
액티브 트레이드
노트
active your trades, now entry level 거래청산: 타겟 닿음
💸FREE FOREX Signals in Telegram : t.me/FxInsightsHub0
🔹Join Our Telegram Channel, Pure Price Action Based Signals With Chart Analysis.
t.me/FxInsightsHub0
🚀FREE CRYPTO Signals In Telegram: t.me/FxInsightsHub0
🔹Join Our Telegram Channel, Pure Price Action Based Signals With Chart Analysis.
t.me/FxInsightsHub0
🚀FREE CRYPTO Signals In Telegram: t.me/FxInsightsHub0
관련 발행물
면책사항
이 정보와 게시물은 TradingView에서 제공하거나 보증하는 금융, 투자, 거래 또는 기타 유형의 조언이나 권고 사항을 의미하거나 구성하지 않습니다. 자세한 내용은 이용 약관을 참고하세요.