Hi Traders
EUR/CAD Multi-Timeframe analysis (Update)
H1 CHART ( Bullish )
A medium probability, entry signal to go LONG was given at 1.53623 after the market found support at 1.53317 . Only the downward break of 1.53317 would cancel the bullish scenario.
Support & Resistances
1.53328 1.53548
1.53030 1.53735
1.52898 1.53975
H4 CHART ( Neutral )
Conflicting technical signals are indicating towards an unstable market, cautioning us to remain neutral and wait for a stronger trend to develop.
Support & Resistances
1.53124 1.53498
1.52619 1.53782
1.52092 1.54414
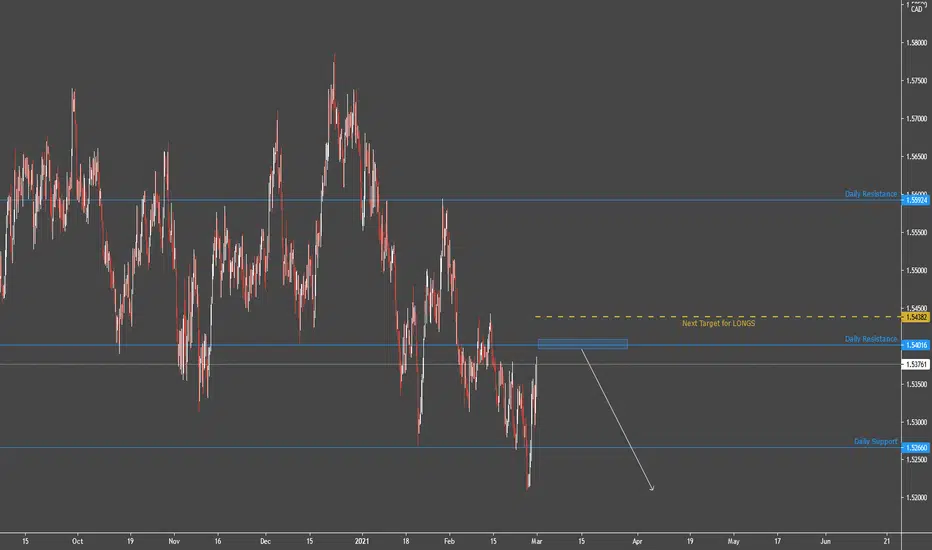
DAILY CHART ( Strong Down )
Waiting for a retracement higher towards the 1.52666 resistance level in order to reinstate SHORT positions. Next important resistance is the 1.54016 level.
Support & Resistances
1.52660 1.52666
1.50744 1.54016
1.47486 1.55924
WEEKLY CHART ( NEUTRAL )
The market is dominated by uncertainty. The occasionally prevailing trend lasts for a limited time and changes its direction too frequently. As long as the market remains unstable, we stay aside, waiting for the market to get back on track.
Support & Resistances
1.52666 1.59912
1.50518 1.62060
1.47707 1.64871
EUR/CAD Multi-Timeframe analysis (Update)
H1 CHART ( Bullish )
A medium probability, entry signal to go LONG was given at 1.53623 after the market found support at 1.53317 . Only the downward break of 1.53317 would cancel the bullish scenario.
Support & Resistances
1.53328 1.53548
1.53030 1.53735
1.52898 1.53975
H4 CHART ( Neutral )
Conflicting technical signals are indicating towards an unstable market, cautioning us to remain neutral and wait for a stronger trend to develop.
Support & Resistances
1.53124 1.53498
1.52619 1.53782
1.52092 1.54414
DAILY CHART ( Strong Down )
Waiting for a retracement higher towards the 1.52666 resistance level in order to reinstate SHORT positions. Next important resistance is the 1.54016 level.
Support & Resistances
1.52660 1.52666
1.50744 1.54016
1.47486 1.55924
WEEKLY CHART ( NEUTRAL )
The market is dominated by uncertainty. The occasionally prevailing trend lasts for a limited time and changes its direction too frequently. As long as the market remains unstable, we stay aside, waiting for the market to get back on track.
Support & Resistances
1.52666 1.59912
1.50518 1.62060
1.47707 1.64871
Get my tool FREE HERE:
bit.ly/2ODALGH
FREE TELEGRAM GROUP:
bit.ly/3rYHjyd
GET MY FREE EDUCATION HERE:
bit.ly/3pQudRX
bit.ly/2ODALGH
FREE TELEGRAM GROUP:
bit.ly/3rYHjyd
GET MY FREE EDUCATION HERE:
bit.ly/3pQudRX
관련 발행물
면책사항
이 정보와 게시물은 TradingView에서 제공하거나 보증하는 금융, 투자, 거래 또는 기타 유형의 조언이나 권고 사항을 의미하거나 구성하지 않습니다. 자세한 내용은 이용 약관을 참고하세요.