A “long-legged” doji is a far more dramatic candle. It says that prices moved far higher on the day, but then profit taking kicked in.
Typically, a very large upper shadow is left. A close below the midpoint of the candle shows a lot of weakness.
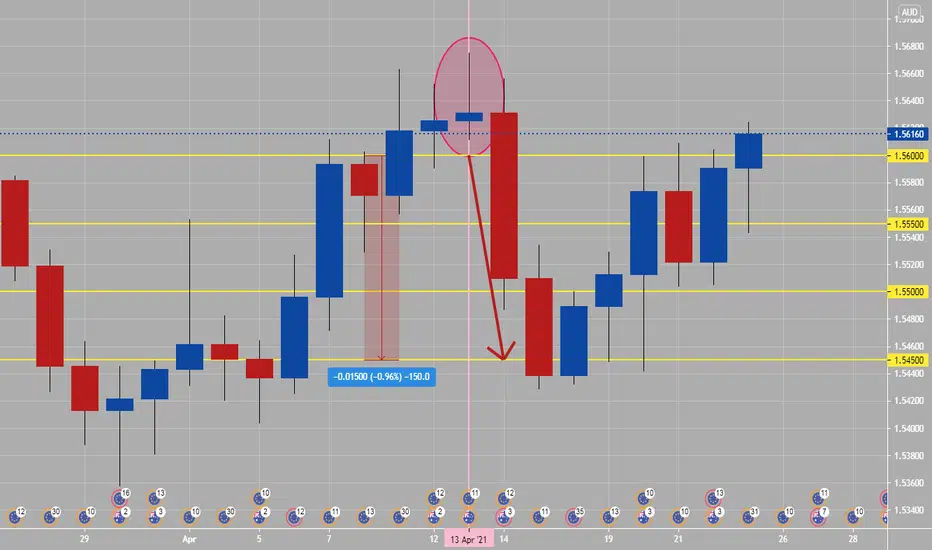
Here’s an example of a long-legged doji on attached chart (inside of oval circle). Daily candlesticks and patterns are more important then lower time frame ones, related to having one whole days of price action inside of them.
Monday and Tuesday daily candlesticks mostly will set high or low of the week, which rest of week trend will break out or come out of. The noted long legged doji occurred on a Tuesday, then rest of week was sell or bearish.
Typically, a very large upper shadow is left. A close below the midpoint of the candle shows a lot of weakness.
Here’s an example of a long-legged doji on attached chart (inside of oval circle). Daily candlesticks and patterns are more important then lower time frame ones, related to having one whole days of price action inside of them.
Monday and Tuesday daily candlesticks mostly will set high or low of the week, which rest of week trend will break out or come out of. The noted long legged doji occurred on a Tuesday, then rest of week was sell or bearish.
면책사항
해당 정보와 게시물은 금융, 투자, 트레이딩 또는 기타 유형의 조언이나 권장 사항으로 간주되지 않으며, 트레이딩뷰에서 제공하거나 보증하는 것이 아닙니다. 자세한 내용은 이용 약관을 참조하세요.
면책사항
해당 정보와 게시물은 금융, 투자, 트레이딩 또는 기타 유형의 조언이나 권장 사항으로 간주되지 않으며, 트레이딩뷰에서 제공하거나 보증하는 것이 아닙니다. 자세한 내용은 이용 약관을 참조하세요.