Here is an update to our post over 45 days ago:

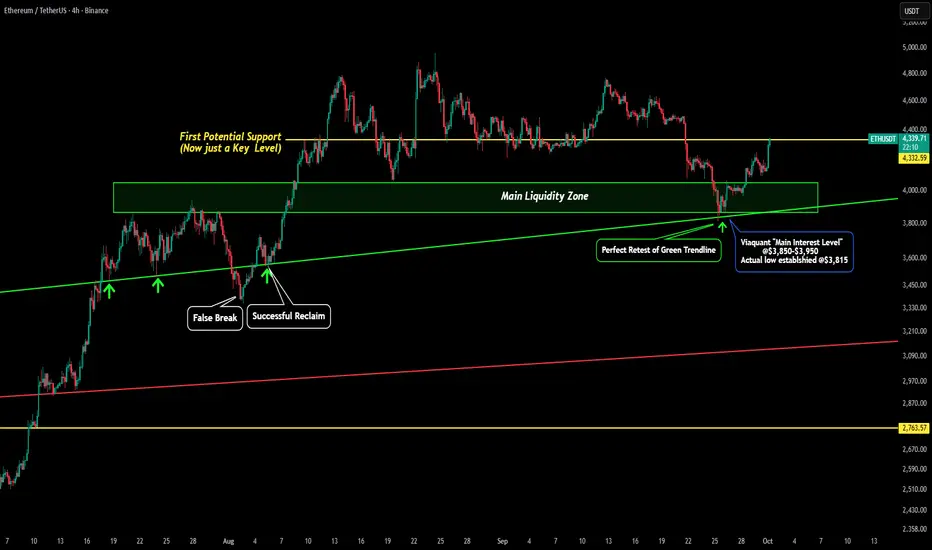
From the time we hit the top @$4,950 we laid out all the levels to watch for ETH. We were watching some short term levels but the MAIN level we were watching for was the green box titled "MAIN LIQUIDITY ZONE". This zone ranged from $3,800-$4,100.
Since this was a multi-year resistance level we were watching it to act as a new macro support level. We pointed out how "buyers should find this level very appealing if we get a dip to there. The main interest level would lie between $3,850-$3,950."
Current day we can see how perfectly this prediction played out.
First main thing to not is the accuracy of our targets: the main level of interest ($3,850-3,950) was just $35 higher than where the actual bottom was established!
Also the "MAIN LIQUDITY ZONE" was even better with it only be $15 lower than the actual bottom being established at $3,815!!
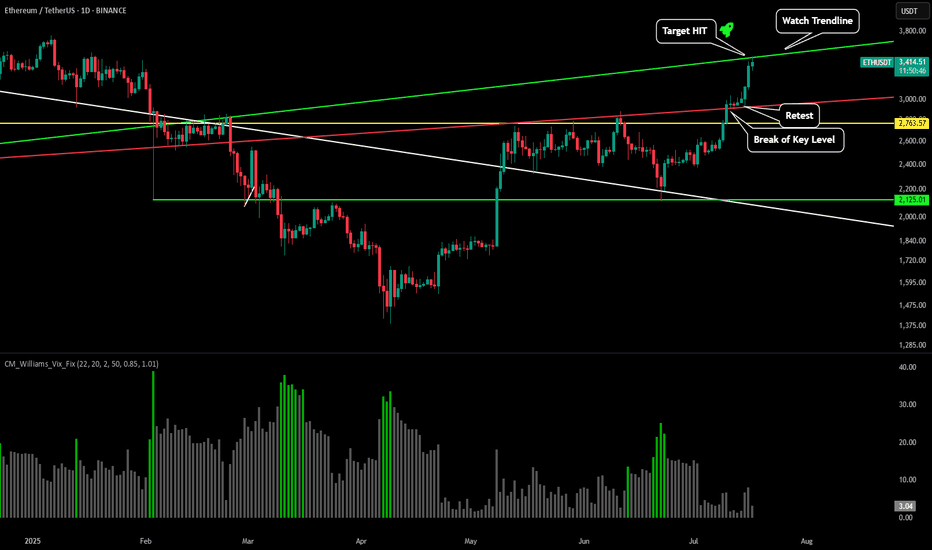
The next key thing to note is how accurately price retested our green trendline. I have been posting about this green trendline for the past 3 months! Here are some other charts where I had this trendline that called the bottom drawn.


From the time we hit the top @$4,950 we laid out all the levels to watch for ETH. We were watching some short term levels but the MAIN level we were watching for was the green box titled "MAIN LIQUIDITY ZONE". This zone ranged from $3,800-$4,100.
Since this was a multi-year resistance level we were watching it to act as a new macro support level. We pointed out how "buyers should find this level very appealing if we get a dip to there. The main interest level would lie between $3,850-$3,950."
Current day we can see how perfectly this prediction played out.
First main thing to not is the accuracy of our targets: the main level of interest ($3,850-3,950) was just $35 higher than where the actual bottom was established!
Also the "MAIN LIQUDITY ZONE" was even better with it only be $15 lower than the actual bottom being established at $3,815!!
The next key thing to note is how accurately price retested our green trendline. I have been posting about this green trendline for the past 3 months! Here are some other charts where I had this trendline that called the bottom drawn.
면책사항
해당 정보와 게시물은 금융, 투자, 트레이딩 또는 기타 유형의 조언이나 권장 사항으로 간주되지 않으며, 트레이딩뷰에서 제공하거나 보증하는 것이 아닙니다. 자세한 내용은 이용 약관을 참조하세요.
면책사항
해당 정보와 게시물은 금융, 투자, 트레이딩 또는 기타 유형의 조언이나 권장 사항으로 간주되지 않으며, 트레이딩뷰에서 제공하거나 보증하는 것이 아닙니다. 자세한 내용은 이용 약관을 참조하세요.