We are the SeoVereign Trading Team.
With sharp insight and precise analysis, we regularly share trading ideas on Bitcoin and other major assets—always guided by structure, sentiment, and momentum.
🔔 Follow us to never miss a market update.
--------------------------------------------------------------------------------------------------------
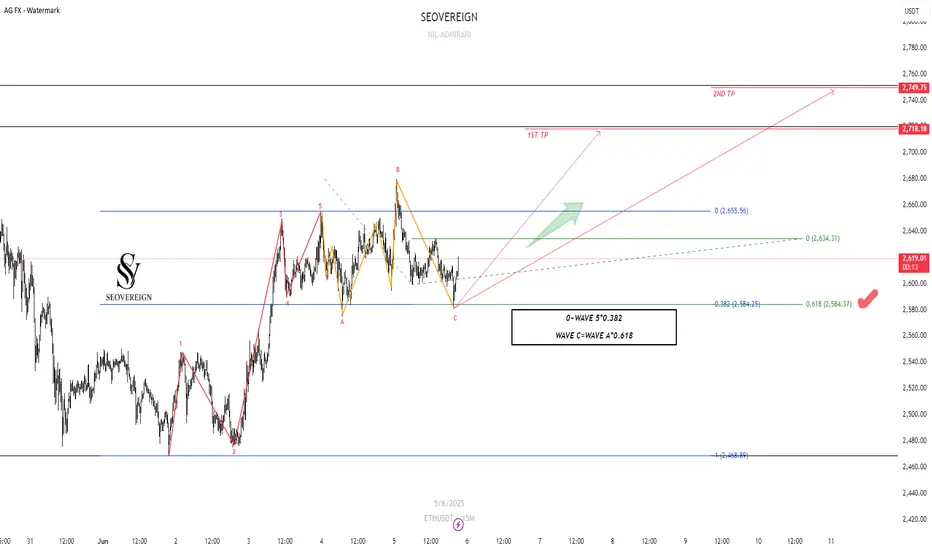
Here is a technical analysis of Ethereum.
The current wave structure is considered to be in the final stage of a corrective wave, with the following evidence based on length ratios.
First, the 5th wave of wave C forms a length that is 0.618 times that of waves 0 to 3.
Second, the fact that wave C ended at the 0.382 Fibonacci retracement level of waves 1 to 5 increases the possibility of technical support.
As these conditions are met, the current zone is considered a valid buying point for entering a long position.
Target Prices
1st target: 2,700
2nd target: 2,750
This zone overlaps with past resistance and technical retracement ratios, making it appropriate as a short-term liquidation zone.
With sharp insight and precise analysis, we regularly share trading ideas on Bitcoin and other major assets—always guided by structure, sentiment, and momentum.
🔔 Follow us to never miss a market update.
--------------------------------------------------------------------------------------------------------
Here is a technical analysis of Ethereum.
The current wave structure is considered to be in the final stage of a corrective wave, with the following evidence based on length ratios.
First, the 5th wave of wave C forms a length that is 0.618 times that of waves 0 to 3.
Second, the fact that wave C ended at the 0.382 Fibonacci retracement level of waves 1 to 5 increases the possibility of technical support.
As these conditions are met, the current zone is considered a valid buying point for entering a long position.
Target Prices
1st target: 2,700
2nd target: 2,750
This zone overlaps with past resistance and technical retracement ratios, making it appropriate as a short-term liquidation zone.
📝서버린 카피트레이딩 실적 공개
🔗blockfin.com/copy-trade/details/21069495763
*모인 자산 (aum)
: 189,426 usdt ≅ 한화 약 2억 7천 8백만 원
(12월 10일 기준)
🔴유튜브 : 카피트레이딩 하는 법
🔗youtube.com/watch?v=GfQ8on4FE-E
🌐텔레그램
🔗t.me/+Sd_TSg2IX3k4Njg1
🔗blockfin.com/copy-trade/details/21069495763
*모인 자산 (aum)
: 189,426 usdt ≅ 한화 약 2억 7천 8백만 원
(12월 10일 기준)
🔴유튜브 : 카피트레이딩 하는 법
🔗youtube.com/watch?v=GfQ8on4FE-E
🌐텔레그램
🔗t.me/+Sd_TSg2IX3k4Njg1
면책사항
해당 정보와 게시물은 금융, 투자, 트레이딩 또는 기타 유형의 조언이나 권장 사항으로 간주되지 않으며, 트레이딩뷰에서 제공하거나 보증하는 것이 아닙니다. 자세한 내용은 이용 약관을 참조하세요.