hi Traders
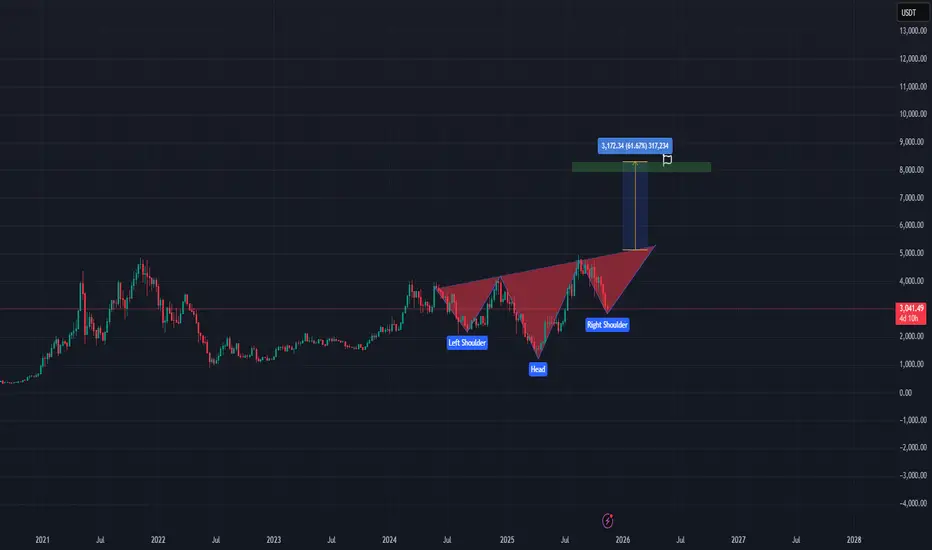
On the weekly chart, Ethereum (ETH/USDT) appears to be developing a potential inverted Head and Shoulders pattern, which is traditionally viewed as a bullish reversal formation.
Pattern Structure
Left Shoulder: Formed during the earlier corrective phase.
Head: A deeper swing low marking capitulation before recovery.
Right Shoulder: Currently forming, with price pushing back toward the neckline.
Neckline & Breakout Zone
Price is approaching the neckline resistance, which aligns with a multi-year structural level. A confirmed weekly close above this neckline would signal a potential breakout.
Measured Move Target
Using the height of the head relative to the neckline, the projected upside target sits approximately 60% above the breakout level, aligning with the highlighted green target zone on the chart.
Bullish Confirmation
A breakout would be confirmed by:
A strong weekly close above the neckline
Increased volume
Retest of the neckline turning into support (optional but ideal)
Key Notes
The pattern is not confirmed until the neckline breaks.
Weekly patterns carry more reliability but also require patience.
As always, risk management remains essential.
💥 Free signals and ideas ➡ t.me/vfinvestment
면책사항
해당 정보와 게시물은 금융, 투자, 트레이딩 또는 기타 유형의 조언이나 권장 사항으로 간주되지 않으며, 트레이딩뷰에서 제공하거나 보증하는 것이 아닙니다. 자세한 내용은 이용 약관을 참조하세요.
💥 Free signals and ideas ➡ t.me/vfinvestment
면책사항
해당 정보와 게시물은 금융, 투자, 트레이딩 또는 기타 유형의 조언이나 권장 사항으로 간주되지 않으며, 트레이딩뷰에서 제공하거나 보증하는 것이 아닙니다. 자세한 내용은 이용 약관을 참조하세요.