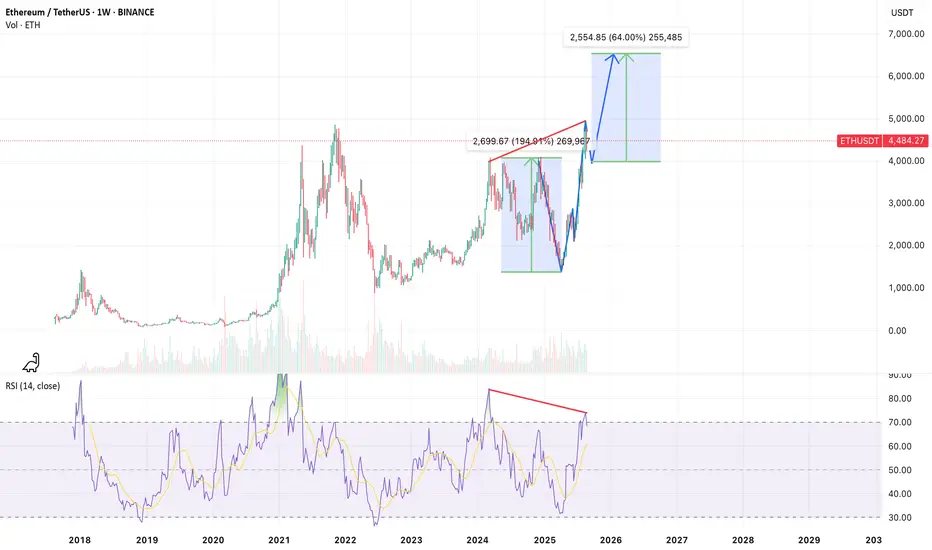
On the weekly timeframe, ETHUSDT is showing signs of a potential V-sharp reversal pattern. A mild bearish divergence can be observed at the recent highs, indicating the likelihood of a corrective move toward the $4,000 support zone before resuming the broader bullish trend targeting the $6,500 area.
For educational purposes only. This is not financial advice.
For educational purposes only. This is not financial advice.
노트
Update1: ETH moved to $4k zone, let's wait & see if it can resume the bullish trend.면책사항
해당 정보와 게시물은 금융, 투자, 트레이딩 또는 기타 유형의 조언이나 권장 사항으로 간주되지 않으며, 트레이딩뷰에서 제공하거나 보증하는 것이 아닙니다. 자세한 내용은 이용 약관을 참조하세요.
면책사항
해당 정보와 게시물은 금융, 투자, 트레이딩 또는 기타 유형의 조언이나 권장 사항으로 간주되지 않으며, 트레이딩뷰에서 제공하거나 보증하는 것이 아닙니다. 자세한 내용은 이용 약관을 참조하세요.