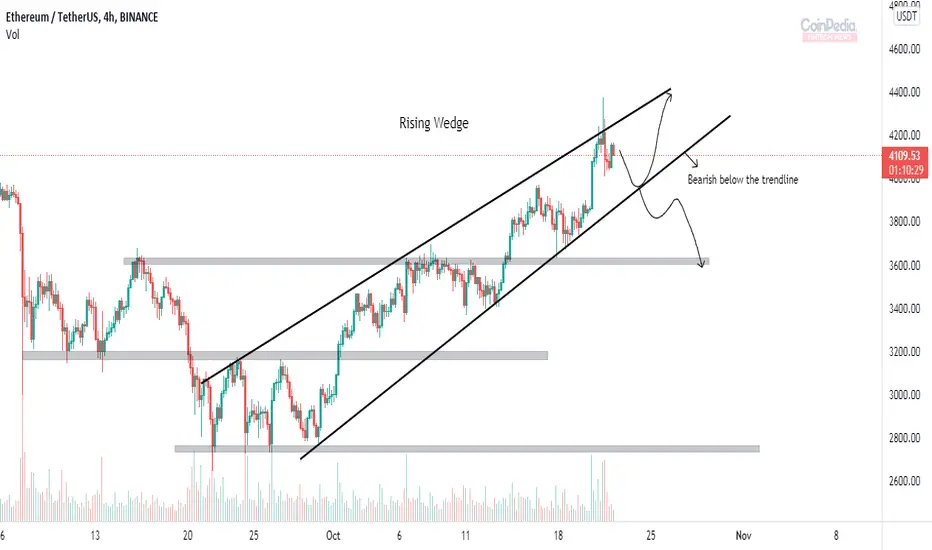
* Ethereum in 4H time frame appears with Rising Wedge pattern.
* Rising wedge occurs when the price moves between two trendlines forming higher-highs and higher-lows. The lower trendline works as support for the price and the upper trendline works as resistance.
* Rising wedge appears with wide bottom and as the price moves higher the range becomes narrow.
* Ethereum can test the lower trendline ( support ) and bounce back, but if it break the support we can expect a drop till below support zone.
면책사항
해당 정보와 게시물은 금융, 투자, 트레이딩 또는 기타 유형의 조언이나 권장 사항으로 간주되지 않으며, 트레이딩뷰에서 제공하거나 보증하는 것이 아닙니다. 자세한 내용은 이용 약관을 참조하세요.
면책사항
해당 정보와 게시물은 금융, 투자, 트레이딩 또는 기타 유형의 조언이나 권장 사항으로 간주되지 않으며, 트레이딩뷰에서 제공하거나 보증하는 것이 아닙니다. 자세한 내용은 이용 약관을 참조하세요.