Spot Strategy | 0xPareto Thesis
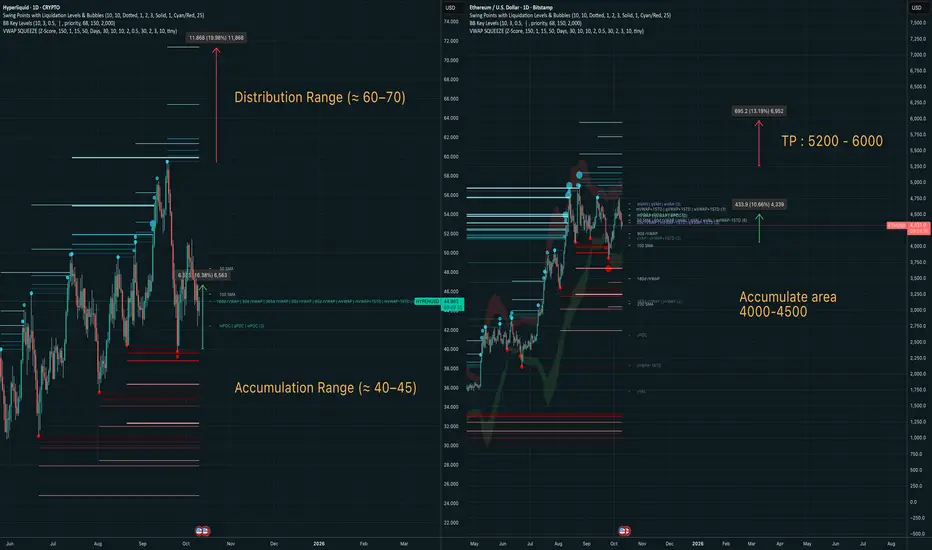
This chart visualizes the ongoing macro accumulation phase across both Ethereum and Hyperliquid, aligning with cyclical VWAP structure and liquidity maps.
Ethereum (Right):
Accumulation area: $4,000–$4,500
Target: $5,200–$6,000
Hyperliquid (Left):
Accumulation range: $40–$45
Distribution range: $60–$70
Mean reversion setup with high confluence on 180d VWAP and prior liquidity clusters.
면책사항
해당 정보와 게시물은 금융, 투자, 트레이딩 또는 기타 유형의 조언이나 권장 사항으로 간주되지 않으며, 트레이딩뷰에서 제공하거나 보증하는 것이 아닙니다. 자세한 내용은 이용 약관을 참조하세요.
면책사항
해당 정보와 게시물은 금융, 투자, 트레이딩 또는 기타 유형의 조언이나 권장 사항으로 간주되지 않으며, 트레이딩뷰에서 제공하거나 보증하는 것이 아닙니다. 자세한 내용은 이용 약관을 참조하세요.