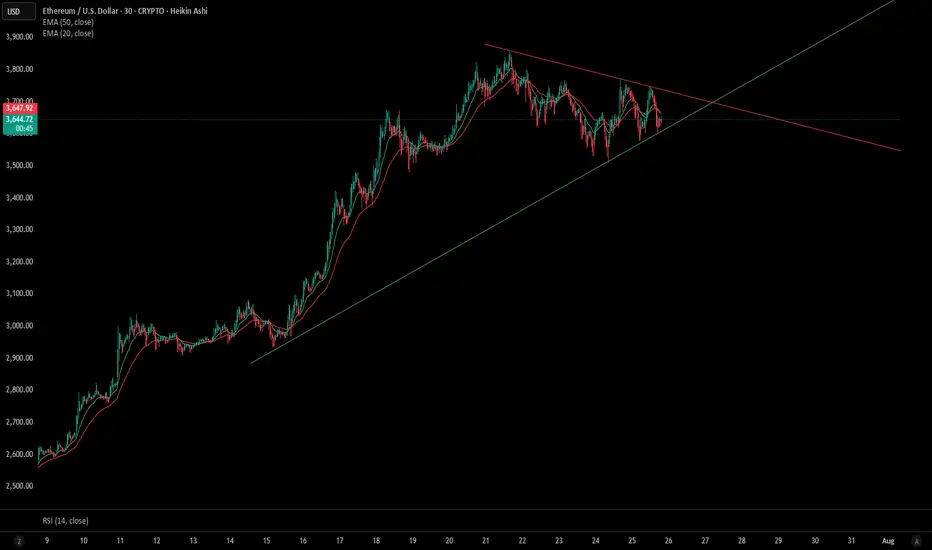
This 30-minute Heikin Ashi chart of Ethereum shows a developing symmetrical triangle pattern, signaling a potential breakout soon. Price action is consolidating between a rising trendline (support) and a descending trendline (resistance), converging near the $3,650 level.
EMAs: Price is currently trading between the 20 EMA ($3,662.61) and 50 EMA ($3,668.01), indicating indecision and tightening volatility.
RSI (14): Neutral at ~47, providing no strong directional bias.
Structure: Higher lows and lower highs define the triangle boundaries.
A breakout above $3,670–$3,700 could signal bullish continuation, while a break below $3,620 may trigger a bearish move.
Keep an eye on volume and RSI divergence to confirm breakout direction. Ideal for short-term traders anticipating a volatility spike.
면책사항
해당 정보와 게시물은 금융, 투자, 트레이딩 또는 기타 유형의 조언이나 권장 사항으로 간주되지 않으며, 트레이딩뷰에서 제공하거나 보증하는 것이 아닙니다. 자세한 내용은 이용 약관을 참조하세요.
면책사항
해당 정보와 게시물은 금융, 투자, 트레이딩 또는 기타 유형의 조언이나 권장 사항으로 간주되지 않으며, 트레이딩뷰에서 제공하거나 보증하는 것이 아닙니다. 자세한 내용은 이용 약관을 참조하세요.