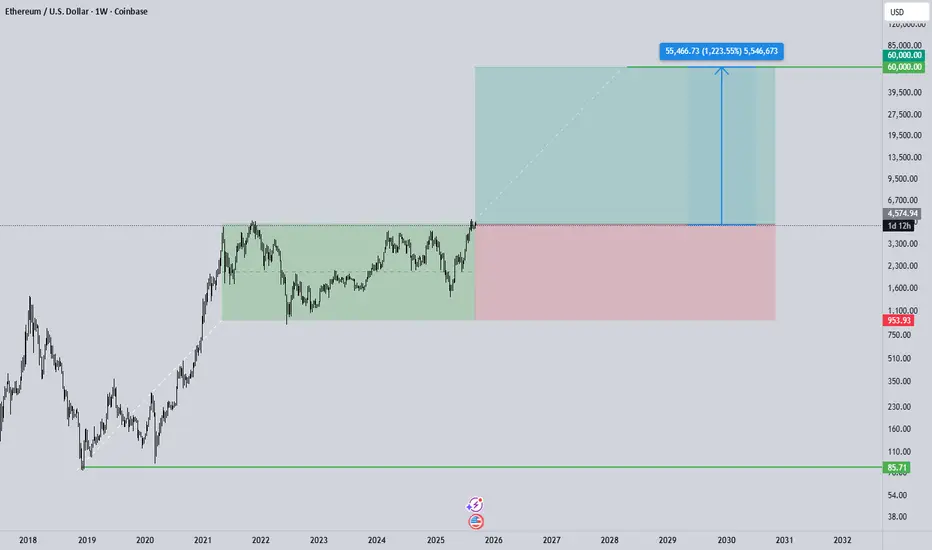
The weekly Ethereum chart shows that after years of consolidation within a broad range (green box), the price is now testing the upper boundary and attempting a breakout. Such behavior typically signals the start of a major bullish phase, provided the breakout is confirmed on the weekly close and the former resistance successfully turns into support. Based on projections, the first intermediate targets could be around 7.4k, 9–12k, and then 16k, while the long-term projection of 60k (+1200% from the current price) represents a highly optimistic multi-year scenario. On the other hand, if the breakout fails and price settles back below resistance, a return to the 1k region is possible. The reward-to-risk ratio of this trade, with a stop at 953 and a target of 60k, is exceptionally high (over 15:1), but the wide stop severely limits position size and demands strict risk management. Therefore, a secure entry should only follow a confirmed weekly close above resistance with a successful retest, and traders should plan for partial profit-taking at intermediate levels along the way.
that Horizon Beyond Data Flows ...
면책사항
이 정보와 게시물은 TradingView에서 제공하거나 보증하는 금융, 투자, 거래 또는 기타 유형의 조언이나 권고 사항을 의미하거나 구성하지 않습니다. 자세한 내용은 이용 약관을 참고하세요.
that Horizon Beyond Data Flows ...
면책사항
이 정보와 게시물은 TradingView에서 제공하거나 보증하는 금융, 투자, 거래 또는 기타 유형의 조언이나 권고 사항을 의미하거나 구성하지 않습니다. 자세한 내용은 이용 약관을 참고하세요.