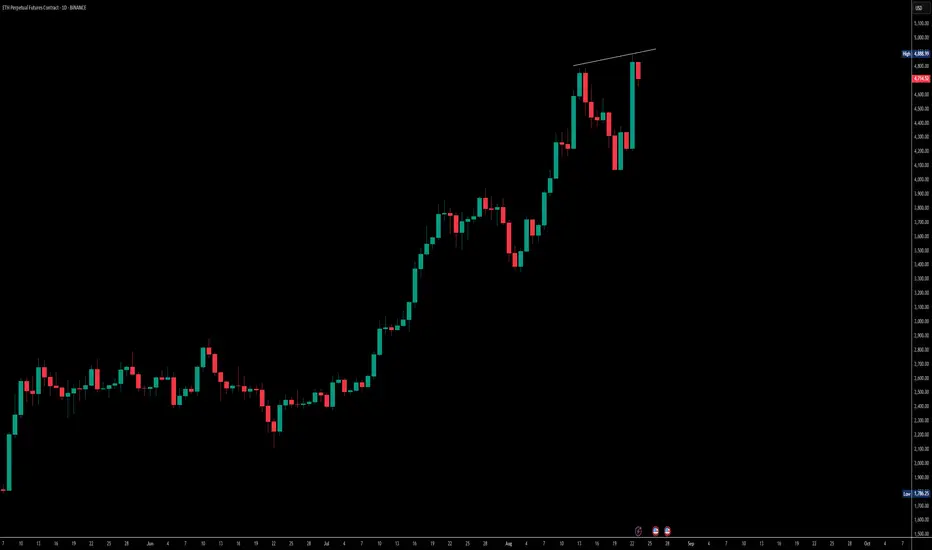
Looking at ETH on the daily timeframe, price action is pushing higher highs, but RSI isn’t fully aligned — it’s only forming a higher low. That usually tells us this move could just be a pullback rather than a strong bullish divergence.
ETH already retested the May 2021 levels, and from here a correction toward $4,450 seems likely. If it holds and rebounds there, momentum can continue, but if it fails, we should be ready for deeper downside. The key support to watch is $4,000 — losing that would open doors for another correction.
On the other side, the stochastic RSI is near the bottom, which suggests a possible bounce. But weekends often come with fake pumps and dumps, so patience is important. Monday evening or Tuesday morning looks like a better window to see whether ETH attempts a proper correction or not.
FOLLOW MY TELEGRAM CHANNEL FOR FREE : bit.ly/3JfrpgV
면책사항
해당 정보와 게시물은 금융, 투자, 트레이딩 또는 기타 유형의 조언이나 권장 사항으로 간주되지 않으며, 트레이딩뷰에서 제공하거나 보증하는 것이 아닙니다. 자세한 내용은 이용 약관을 참조하세요.
FOLLOW MY TELEGRAM CHANNEL FOR FREE : bit.ly/3JfrpgV
면책사항
해당 정보와 게시물은 금융, 투자, 트레이딩 또는 기타 유형의 조언이나 권장 사항으로 간주되지 않으며, 트레이딩뷰에서 제공하거나 보증하는 것이 아닙니다. 자세한 내용은 이용 약관을 참조하세요.