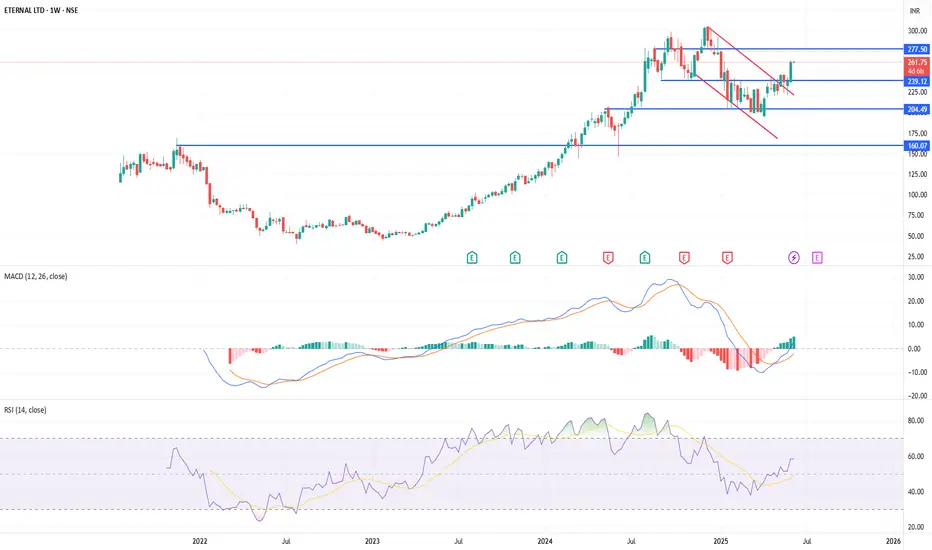
ETERNAL LTD is showing a positive technical setup on the weekly chart as of June 9, 2025. The stock has broken out of a falling wedge pattern and retested the same breakout zone of 230 levels, indicating a potential bullish reversal. Momentum indicators support the move, with the MACD moving upwards and the RSI rising to 58.5, suggesting strengthening buying interest without being overbought. This is just for educational purpose and not any recommendation.
면책사항
해당 정보와 게시물은 금융, 투자, 트레이딩 또는 기타 유형의 조언이나 권장 사항으로 간주되지 않으며, 트레이딩뷰에서 제공하거나 보증하는 것이 아닙니다. 자세한 내용은 이용 약관을 참조하세요.
면책사항
해당 정보와 게시물은 금융, 투자, 트레이딩 또는 기타 유형의 조언이나 권장 사항으로 간주되지 않으며, 트레이딩뷰에서 제공하거나 보증하는 것이 아닙니다. 자세한 내용은 이용 약관을 참조하세요.