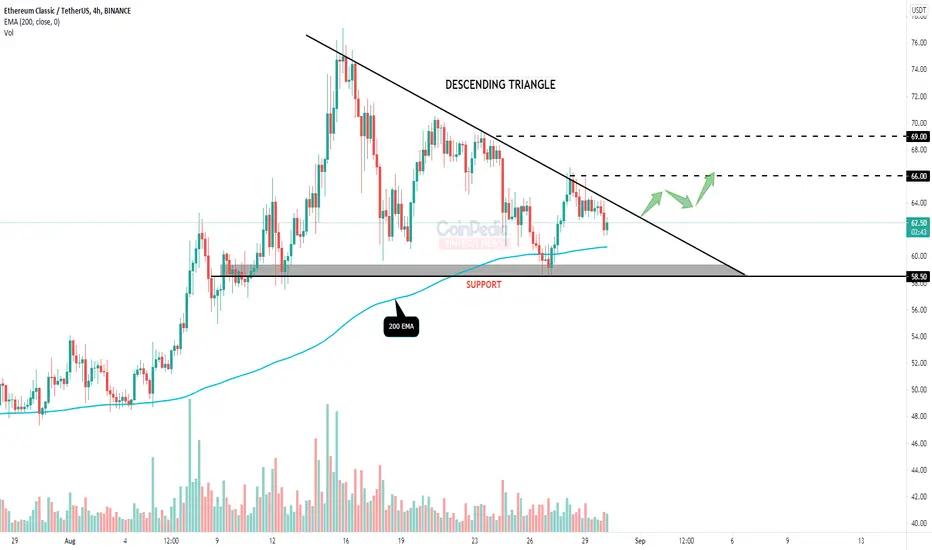
* Ethereum classic in 4H time frame forms a descending triangle with it's support near $58.5 and the above trend-line as it's resistance.
* The 200 EMA ( Exponential moving average ) is working as support for the price.
* If the price breaks the upper trend-line (resistance) we can expect a bullish move till $69.
* ETC is bearish below it's support zone.
* The 200 EMA ( Exponential moving average ) is working as support for the price.
* If the price breaks the upper trend-line (resistance) we can expect a bullish move till $69.
* ETC is bearish below it's support zone.
거래청산: 타겟 닿음
면책사항
이 정보와 게시물은 TradingView에서 제공하거나 보증하는 금융, 투자, 거래 또는 기타 유형의 조언이나 권고 사항을 의미하거나 구성하지 않습니다. 자세한 내용은 이용 약관을 참고하세요.
면책사항
이 정보와 게시물은 TradingView에서 제공하거나 보증하는 금융, 투자, 거래 또는 기타 유형의 조언이나 권고 사항을 의미하거나 구성하지 않습니다. 자세한 내용은 이용 약관을 참고하세요.