Overview: let's review a few key points of the update of yesterday:
Update: I have to repeat one more point from the previous updates: "the price action is nicely following our expectations."!
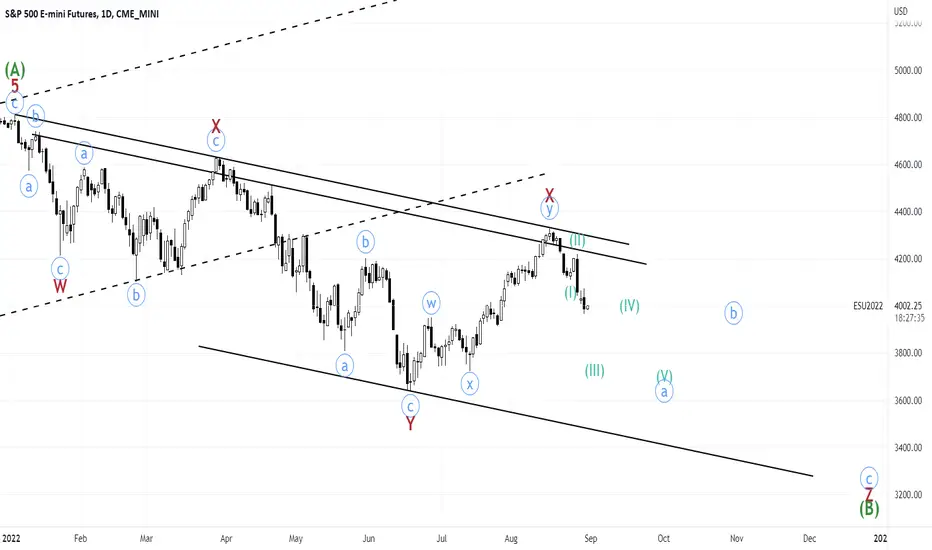
Let's look at the hourly chart:
In wave b of (III), we formed a lower low as the second wave X, then peaked at 4072.75 and finally broke the upward channel decisively.
Now, I believe today we formed wave 1 of c of (III).

What is my target for wave 2 of c of (III)?
Let's go to the 15 min chart: it seems the market loves to make nested wxyxz corrections and head & shoulders on this bearish phase.
There are 4 ways to have an idea of what can be wave 2 peak (4028-4031.5):
1) Retracement of wave 1 of c of (III): 4009.25, 4018.75, 4028, 4031.5, and 4036.75
2) Volume profile of wave 1 of c of (III): based on the volume profile, we can consider these targets: 4020.25, 4032.75 (note that these two numbers are not exact)

3) The price target of the head & shoulder pattern: 4026

4) Support and resistance levels: 4017, 4029.25, and 4039.75

Finally, this is the structure of wave 2 of c of (III):

- I believe wave b is not complete yet and I expect it to turn into a triple zigzag retesting 4076.75 area.
- If we break the upward channel decisively, then wave b is complete and we have started wave c of (III).
- Note that based on the price target of the head & shoulders pattern, I believe the second wave X is yet to be complete as shown on the 5-min chart.
Update: I have to repeat one more point from the previous updates: "the price action is nicely following our expectations."!
Let's look at the hourly chart:
In wave b of (III), we formed a lower low as the second wave X, then peaked at 4072.75 and finally broke the upward channel decisively.
Now, I believe today we formed wave 1 of c of (III).
What is my target for wave 2 of c of (III)?
Let's go to the 15 min chart: it seems the market loves to make nested wxyxz corrections and head & shoulders on this bearish phase.
There are 4 ways to have an idea of what can be wave 2 peak (4028-4031.5):
1) Retracement of wave 1 of c of (III): 4009.25, 4018.75, 4028, 4031.5, and 4036.75
2) Volume profile of wave 1 of c of (III): based on the volume profile, we can consider these targets: 4020.25, 4032.75 (note that these two numbers are not exact)
3) The price target of the head & shoulder pattern: 4026
4) Support and resistance levels: 4017, 4029.25, and 4039.75
Finally, this is the structure of wave 2 of c of (III):
관련 발행물
면책사항
해당 정보와 게시물은 금융, 투자, 트레이딩 또는 기타 유형의 조언이나 권장 사항으로 간주되지 않으며, 트레이딩뷰에서 제공하거나 보증하는 것이 아닙니다. 자세한 내용은 이용 약관을 참조하세요.
면책사항
해당 정보와 게시물은 금융, 투자, 트레이딩 또는 기타 유형의 조언이나 권장 사항으로 간주되지 않으며, 트레이딩뷰에서 제공하거나 보증하는 것이 아닙니다. 자세한 내용은 이용 약관을 참조하세요.