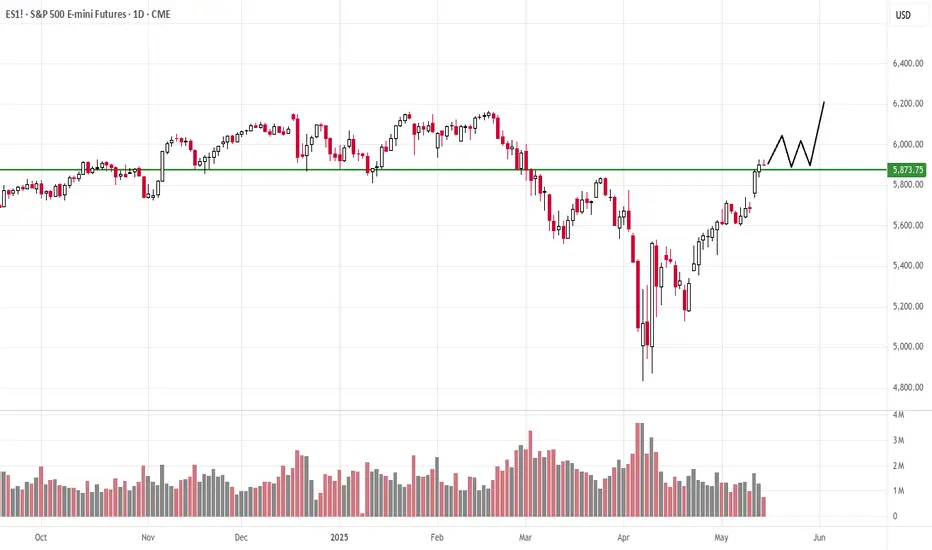
The S&P is now reaching the axis line, where heavy selling emerged months ago. It’s reasonable to expect a pause at this level, followed by a continuation of the strong uptrend.
Volume Analysis
Looking at the recent chart pattern, we can observe that the volume became quite climactic right on the break. It’s particularly noteworthy that the current bar is at the same level as previous significant price action. This pattern suggests we’re essentially going through the same cycle again, repeating familiar market behavior.
The Critical Axis Line
This axis line is critical for traders to monitor. If the market can successfully break above this level and then consolidate, spending sufficient time above this resistance, we’re likely going to experience a rally.
Chart Pattern Observations
The chart shows several technical elements:
Conclusion
The S&P is at a critical juncture, testing a well-established axis line. If we can get above it and then just consolidate, spending some time there, we’re probably going to have a rally.
Volume Analysis
Looking at the recent chart pattern, we can observe that the volume became quite climactic right on the break. It’s particularly noteworthy that the current bar is at the same level as previous significant price action. This pattern suggests we’re essentially going through the same cycle again, repeating familiar market behavior.
The Critical Axis Line
This axis line is critical for traders to monitor. If the market can successfully break above this level and then consolidate, spending sufficient time above this resistance, we’re likely going to experience a rally.
Chart Pattern Observations
The chart shows several technical elements:
- Multiple touch points along the resistance level
- Previous price action at similar levels
- The market cycling through similar patterns again
Conclusion
The S&P is at a critical juncture, testing a well-established axis line. If we can get above it and then just consolidate, spending some time there, we’re probably going to have a rally.
Wyckoff Method Trading and Education
wyckoffanalytics.com/
Stocks, Commodities, Indexes,
Cryptocurrencies
wyckoffanalytics.com/
Stocks, Commodities, Indexes,
Cryptocurrencies
면책사항
이 정보와 게시물은 TradingView에서 제공하거나 보증하는 금융, 투자, 거래 또는 기타 유형의 조언이나 권고 사항을 의미하거나 구성하지 않습니다. 자세한 내용은 이용 약관을 참고하세요.
Wyckoff Method Trading and Education
wyckoffanalytics.com/
Stocks, Commodities, Indexes,
Cryptocurrencies
wyckoffanalytics.com/
Stocks, Commodities, Indexes,
Cryptocurrencies
면책사항
이 정보와 게시물은 TradingView에서 제공하거나 보증하는 금융, 투자, 거래 또는 기타 유형의 조언이나 권고 사항을 의미하거나 구성하지 않습니다. 자세한 내용은 이용 약관을 참고하세요.