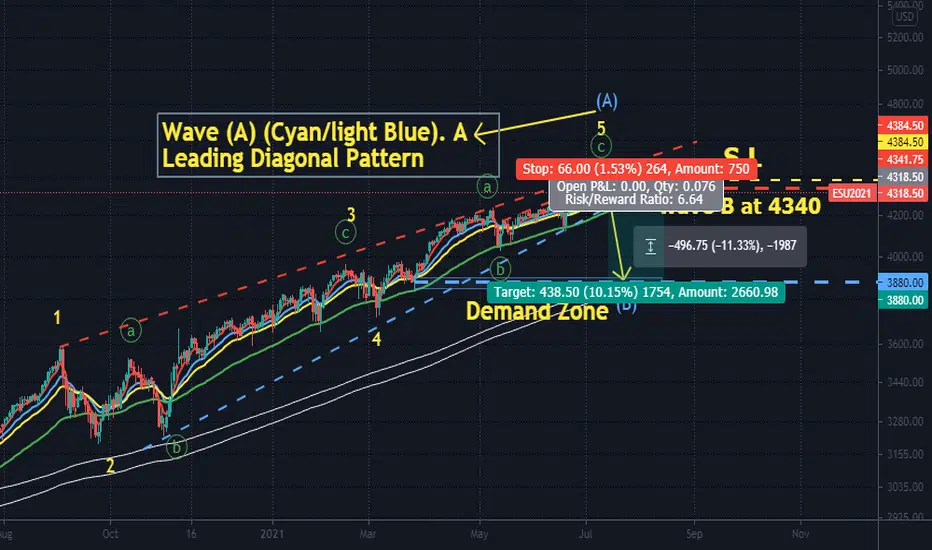
SPX with price breaking low of 4340 which is wave b of subwave of wave 5( Not shown on chart). SPX probably completed its leading diagonal pattern .. Short SPX toward around 3880 which is 1) Daily 200 EMA line 2) The Next Major Demand Zone ... Stop lost at 4384.50.... A Risk /Reward Ratio of about 6.64!
노트
xyz3dtrading.. Charts consist of 3Dimensions - The X-factor ( Time or Cycle ), The Y- factor ( Price Geometry ), AND The Z-factor ( The Speed )노트
It seem like SPX recent impulsive move down is a C leg of expanding flat pattern. SO SPX still will be breaking all time High again!면책사항
해당 정보와 게시물은 금융, 투자, 트레이딩 또는 기타 유형의 조언이나 권장 사항으로 간주되지 않으며, 트레이딩뷰에서 제공하거나 보증하는 것이 아닙니다. 자세한 내용은 이용 약관을 참조하세요.
면책사항
해당 정보와 게시물은 금융, 투자, 트레이딩 또는 기타 유형의 조언이나 권장 사항으로 간주되지 않으며, 트레이딩뷰에서 제공하거나 보증하는 것이 아닙니다. 자세한 내용은 이용 약관을 참조하세요.