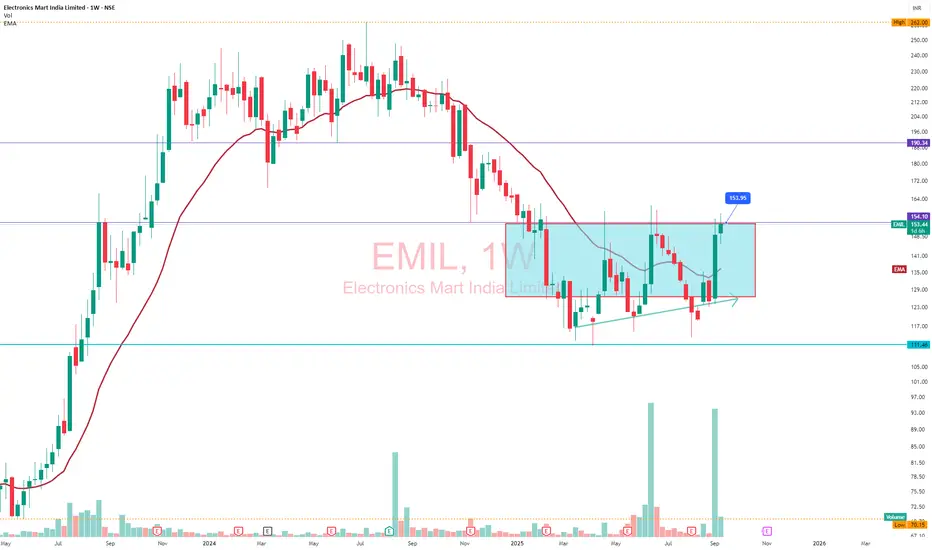
Electronics Mart India Ltd (EMIL) shows a strong bullish trend on the 1-month chart, with weekly growth gaining momentum throughout September 2025.
Watch out above 154 around... Look's good for 190 in short term.
Time Frame: Within Few Weeks.
Overview:
Weekly Price Movement (September 2025)
Week 1: EMIL began the month around ₹125, accelerating rapidly above ₹135 by the week’s end.
Week 2: The price broke out strongly to ₹145–₹150, reflecting increased buying volume and positive sentiment due to strong returns.
Week 3: The share advanced further, briefly touching highs of ₹153 before settling between ₹148–₹151.
Overall monthly gain: Nearly 22–24% increase.
Chart Pattern Analysis:
Trend Direction: Uptrend, as price created new short-term highs each week.
Pattern: Breakout above last month’s resistance zone near ₹130, followed by strong upward candles — typical of momentum-driven rallies.
Volume: Weekly volumes surged, confirming strength behind the move.
Volatility: The stock was volatile, but upward momentum prevailed as sellers failed to counter bullish pressure, with intra-week dips consistently getting bought.
면책사항
이 정보와 게시물은 TradingView에서 제공하거나 보증하는 금융, 투자, 거래 또는 기타 유형의 조언이나 권고 사항을 의미하거나 구성하지 않습니다. 자세한 내용은 이용 약관을 참고하세요.
면책사항
이 정보와 게시물은 TradingView에서 제공하거나 보증하는 금융, 투자, 거래 또는 기타 유형의 조언이나 권고 사항을 의미하거나 구성하지 않습니다. 자세한 내용은 이용 약관을 참고하세요.