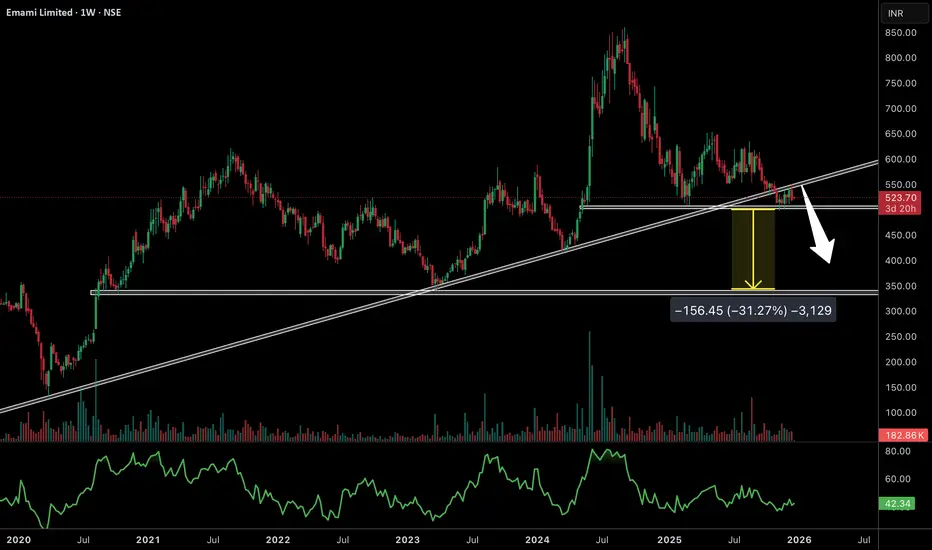
Emami on the weekly timeframe is trading at a very critical structural zone, where a long-term rising trendline overlaps with a key horizontal support area. This zone has acted as an important demand base in the past, but the recent price behaviour shows clear weakness near resistance.
After a sharp rally earlier, the stock has been making lower highs, indicating loss of momentum. The recent pullback has brought price back to the trendline, but unlike previous tests, the bounce is weak and unconvincing, suggesting buyers are not aggressive here.
The highlighted downside zone on the chart clearly shows the risk of a deeper correction if this support fails. A decisive breakdown below the rising trendline can open the door for a fast decline towards the next major demand area, which is placed much lower.
RSI is hovering around the 40–45 zone, reflecting weak momentum and absence of bullish strength. This RSI structure supports the idea that the stock is still in a corrective phase, not ready for trend continuation yet.
Overall, Emami is at a make-or-break level. Holding above the trendline can lead to sideways consolidation, but a weekly close below support would confirm a trend breakdown, shifting the structure firmly into a bearish corrective move. This is a chart that demands caution until strength clearly returns.
Join our community in telegram for real time updates --- telegram.me/marketiik
Telegram- telegram.me/marketiik
A simple trader, distancing from the fake crowd. Simplifying complexity, I prioritize genuine insights over trends.
Telegram- telegram.me/marketiik
A simple trader, distancing from the fake crowd. Simplifying complexity, I prioritize genuine insights over trends.
면책사항
해당 정보와 게시물은 금융, 투자, 트레이딩 또는 기타 유형의 조언이나 권장 사항으로 간주되지 않으며, 트레이딩뷰에서 제공하거나 보증하는 것이 아닙니다. 자세한 내용은 이용 약관을 참조하세요.