📈 Daily Support & Resistance Levels
Based on recent data, here are the critical levels:
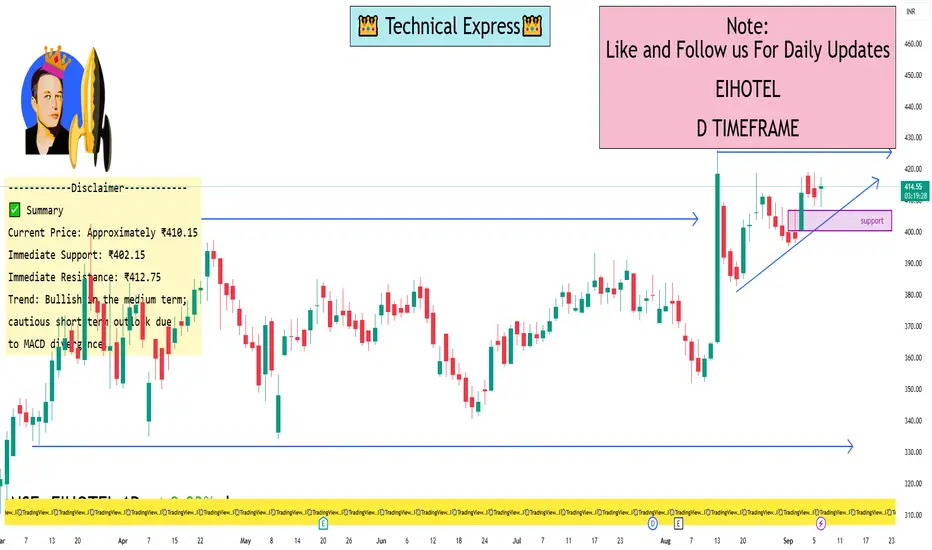
Support Levels:
S1: ₹402.15
S2: ₹396.05
S3: ₹388.93
Resistance Levels:
R1: ₹412.75
R2: ₹417.25
R3: ₹423.35
These levels are derived from standard pivot point calculations and provide insight into potential price reversal zones.
🔍 Technical Indicators Overview
RSI (14-day): 55.79 – Neutral, indicating neither overbought nor oversold conditions.
MACD: 7.41 – Suggests a bearish trend, as the MACD line is above the signal line.
Moving Averages:
5-day EMA: ₹399.37 – Slightly below the current price, indicating a short-term bearish trend.
20-day EMA: ₹391.96 – Above the current price, suggesting medium-term bullish momentum.
50-day EMA: ₹381.97 – Above the current price, reinforcing the medium-term bullish outlook.
🧭 Trend Analysis
The stock is trading above its 20-day and 50-day EMAs, which typically indicates a bullish trend. However, the MACD suggests a potential short-term bearish phase. Traders should monitor the support and resistance levels closely for potential breakout or breakdown opportunities.
Based on recent data, here are the critical levels:
Support Levels:
S1: ₹402.15
S2: ₹396.05
S3: ₹388.93
Resistance Levels:
R1: ₹412.75
R2: ₹417.25
R3: ₹423.35
These levels are derived from standard pivot point calculations and provide insight into potential price reversal zones.
🔍 Technical Indicators Overview
RSI (14-day): 55.79 – Neutral, indicating neither overbought nor oversold conditions.
MACD: 7.41 – Suggests a bearish trend, as the MACD line is above the signal line.
Moving Averages:
5-day EMA: ₹399.37 – Slightly below the current price, indicating a short-term bearish trend.
20-day EMA: ₹391.96 – Above the current price, suggesting medium-term bullish momentum.
50-day EMA: ₹381.97 – Above the current price, reinforcing the medium-term bullish outlook.
🧭 Trend Analysis
The stock is trading above its 20-day and 50-day EMAs, which typically indicates a bullish trend. However, the MACD suggests a potential short-term bearish phase. Traders should monitor the support and resistance levels closely for potential breakout or breakdown opportunities.
I built a Buy & Sell Signal Indicator with 85% accuracy.
📈 Get access via DM or
WhatsApp: wa.link/d997q0
| Email: techncialexpress@gmail.com
| Script Coder | Trader | Investor | From India
📈 Get access via DM or
WhatsApp: wa.link/d997q0
| Email: techncialexpress@gmail.com
| Script Coder | Trader | Investor | From India
관련 발행물
면책사항
이 정보와 게시물은 TradingView에서 제공하거나 보증하는 금융, 투자, 거래 또는 기타 유형의 조언이나 권고 사항을 의미하거나 구성하지 않습니다. 자세한 내용은 이용 약관을 참고하세요.