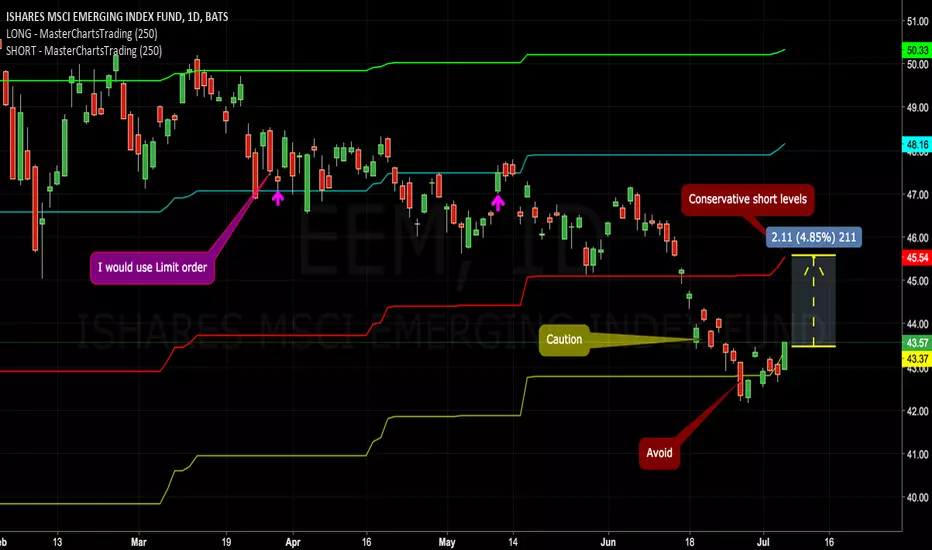
The Blue indicator line serves as a Bullish Trend setter.
If your instrument closes above the Blue line, we think about going Long.
If your instrument closes below the Red line, we think about Shorting.
For Stocks, I prefer to use the Yellow line as my Bearish Trend setter (on Daily charts).
Find out more. Send Private Mail (PM) to mastercharts
FREE Trial of These Indicators. Sign-Up for access here: masterchartstrading.com/store/c1/Featured_Products.html
Visit my financial blog & get alerts : masterchartstrading.com/blog
@mastercharts
Visit my financial blog & get alerts : masterchartstrading.com/blog
@mastercharts
관련 발행물
면책사항
이 정보와 게시물은 TradingView에서 제공하거나 보증하는 금융, 투자, 거래 또는 기타 유형의 조언이나 권고 사항을 의미하거나 구성하지 않습니다. 자세한 내용은 이용 약관을 참고하세요.