Description:
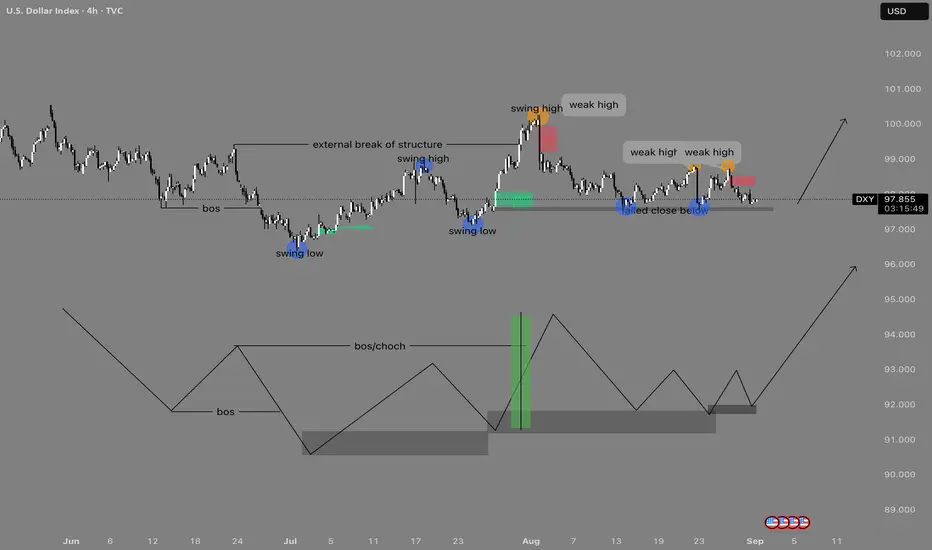
This chart highlights a bullish idea on the Dollar Index (DXY), with structure and liquidity concepts driving the outlook.
Swing Structure:
Price formed a major swing low after a clear BOS (break of structure) to the downside. From there, buyers stepped in, creating a new swing high and pushing into an external BOS, confirming higher-timeframe strength.
Weak Highs & Liquidity Pools:
Multiple weak highs (highlighted in orange) remain unprotected and serve as liquidity targets. These highs are unlikely to hold, suggesting the market will eventually raid them as it seeks upside continuation.
Demand Zones & Failed Close:
Despite temporary sell-offs, the market failed to close below key support (annotated near 97.80–97.00), showing absorption of selling pressure. Fair Value Gaps (FVGs) also act as areas of re-accumulation where buyers can step back in.
Schematic Alignment:
The lower schematic illustrates the anticipated accumulation process: a BOS/CHOCH leading into demand mitigation, followed by higher-lows being built and a final expansion phase. This aligns with the live chart, projecting a bullish run once the corrective phase completes.
Outlook:
As long as price respects the current demand zone, DXY is positioned for continuation to the upside, with liquidity objectives above 99.00 and potentially 100+. A deeper retracement toward 96.00–95.00 would still fit the bullish accumulation model and provide an additional long opportunity.
면책사항
이 정보와 게시물은 TradingView에서 제공하거나 보증하는 금융, 투자, 거래 또는 기타 유형의 조언이나 권고 사항을 의미하거나 구성하지 않습니다. 자세한 내용은 이용 약관을 참고하세요.
면책사항
이 정보와 게시물은 TradingView에서 제공하거나 보증하는 금융, 투자, 거래 또는 기타 유형의 조언이나 권고 사항을 의미하거나 구성하지 않습니다. 자세한 내용은 이용 약관을 참고하세요.