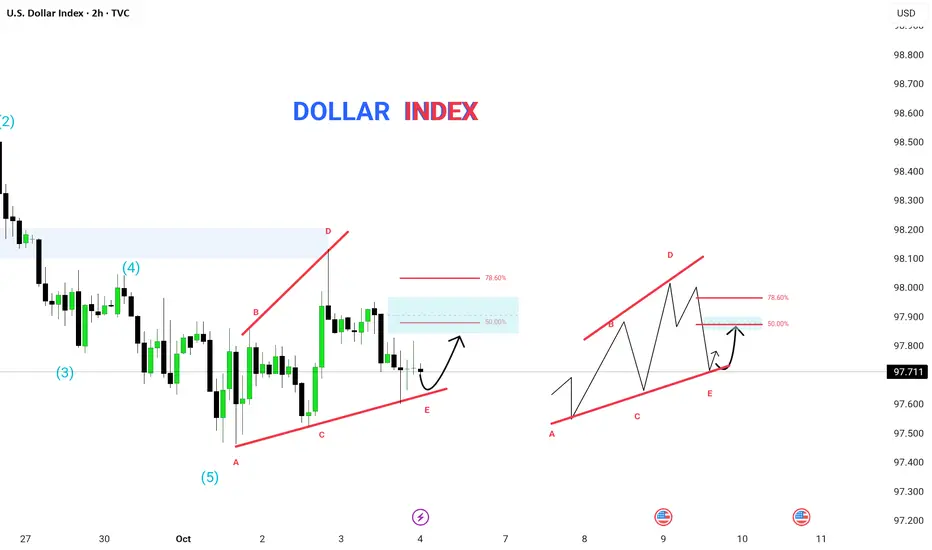
The US Dollar Index (2H timeframe) is currently developing a corrective wedge structure (A–B–C–D–E) following a completed 5-wave bearish impulse. The current price action suggests a potential bullish correction from the E-point.
🔹 Technical Structure Breakdown:
The previous bearish leg completed a Wave (5), marking the end of an impulse cycle.
Price is now consolidating within a rising wedge pattern, forming the A–B–C–D–E structure.
The E-point is acting as a near-term support, aligning with the ascending wedge base.
Retracement targets:
50.0% → short-term correction level
78.6% → ideal reversal zone before continuation
📊 Key Levels to Watch:
Support Zone: 97.600 – 97.500
Resistance Zone: 97.900 – 98.100
Fib Targets: 50% and 78.6% retracement of the recent swing
⚡ Analyst View:
The E-point bounce could lead to a short-term bullish corrective move toward the 50–78.6% Fibonacci levels before resuming the next bearish leg as part of a broader downtrend.
Traders should monitor reaction at the wedge top for possible rejection and reversal confirmation.
🧠 Pattern: Rising Wedge inside corrective phase
🕓 Timeframe: 2H
💰 Instrument: US Dollar Index (DXY)
🎯 Bias: Short-term bullish correction → medium-term bearish continuation
관련 발행물
면책사항
해당 정보와 게시물은 금융, 투자, 트레이딩 또는 기타 유형의 조언이나 권장 사항으로 간주되지 않으며, 트레이딩뷰에서 제공하거나 보증하는 것이 아닙니다. 자세한 내용은 이용 약관을 참조하세요.
관련 발행물
면책사항
해당 정보와 게시물은 금융, 투자, 트레이딩 또는 기타 유형의 조언이나 권장 사항으로 간주되지 않으며, 트레이딩뷰에서 제공하거나 보증하는 것이 아닙니다. 자세한 내용은 이용 약관을 참조하세요.