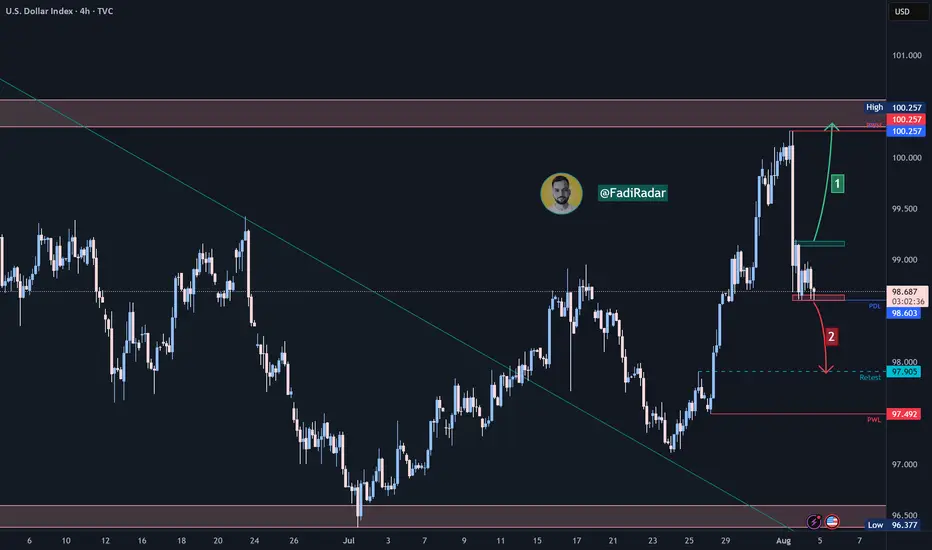
The DXY is currently moving sideways near the 98.65 support zone after a sharp drop from the 100.25 resistance, which marked last week’s high.
🔹 Bearish Scenario:
If the price breaks below 98.65 and holds, a continuation toward 97.90 is likely, with potential to reach the 97.50 support area.
🔹 Bullish Scenario:
If the price reclaims 99.00 and confirms support above it, we could see a retest of the 99.50–100.25 resistance zone, which remains key in the short term.
⚠️ Disclaimer:
This analysis is not financial advice. It is recommended to monitor the markets and carefully analyze the data before making any investment decisions.
면책사항
해당 정보와 게시물은 금융, 투자, 트레이딩 또는 기타 유형의 조언이나 권장 사항으로 간주되지 않으며, 트레이딩뷰에서 제공하거나 보증하는 것이 아닙니다. 자세한 내용은 이용 약관을 참조하세요.
면책사항
해당 정보와 게시물은 금융, 투자, 트레이딩 또는 기타 유형의 조언이나 권장 사항으로 간주되지 않으며, 트레이딩뷰에서 제공하거나 보증하는 것이 아닙니다. 자세한 내용은 이용 약관을 참조하세요.