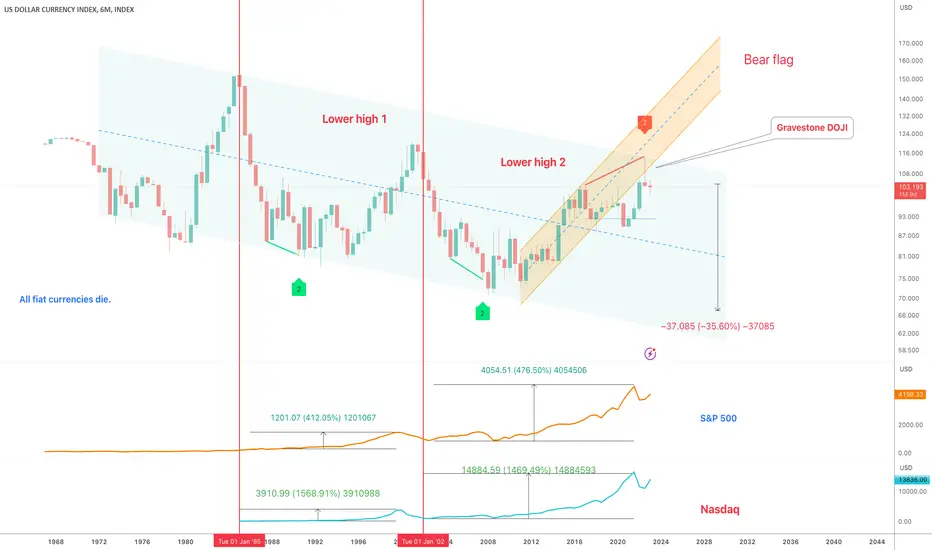
A lot of information in the above 6-month chart of the dollar index, could discuss for hours.. some highlights:
1) The bearish divergence currently printing shall confirm by July 2023 should 100 level collapse. It is the only time in history a bearish divergence of this strength has printed on the 6-month chart.
2) IF it confirms, the index will target the lower side of the channel around 60-70 level.
3) Notice the trend of the index, lower highs lower lows. It is remarkable how many are bullish on the dollar, in the macro sense.
4) Both the S&P 500 and the NASDAQ made considerable gains in the 10-year period that followed a rejection from the upper side of the channel. Many ‘experts’ now talk about the coming lost decade. Gold is the only option, they say. Is that what you see in this chart?! Not what I’m seeing..
Will return in July to see how this candle prints, however with 1.3 months to go it is not looking good for the dollar.
Ww
매매 수동청산
관련 발행물
면책사항
해당 정보와 게시물은 금융, 투자, 트레이딩 또는 기타 유형의 조언이나 권장 사항으로 간주되지 않으며, 트레이딩뷰에서 제공하거나 보증하는 것이 아닙니다. 자세한 내용은 이용 약관을 참조하세요.
관련 발행물
면책사항
해당 정보와 게시물은 금융, 투자, 트레이딩 또는 기타 유형의 조언이나 권장 사항으로 간주되지 않으며, 트레이딩뷰에서 제공하거나 보증하는 것이 아닙니다. 자세한 내용은 이용 약관을 참조하세요.