As of June 6, 2025, Dr. Reddy's Laboratories Ltd. (NSE: DRREDDY) is trading at approximately ₹1,290.60, reflecting a 3.04% increase over the previous day.
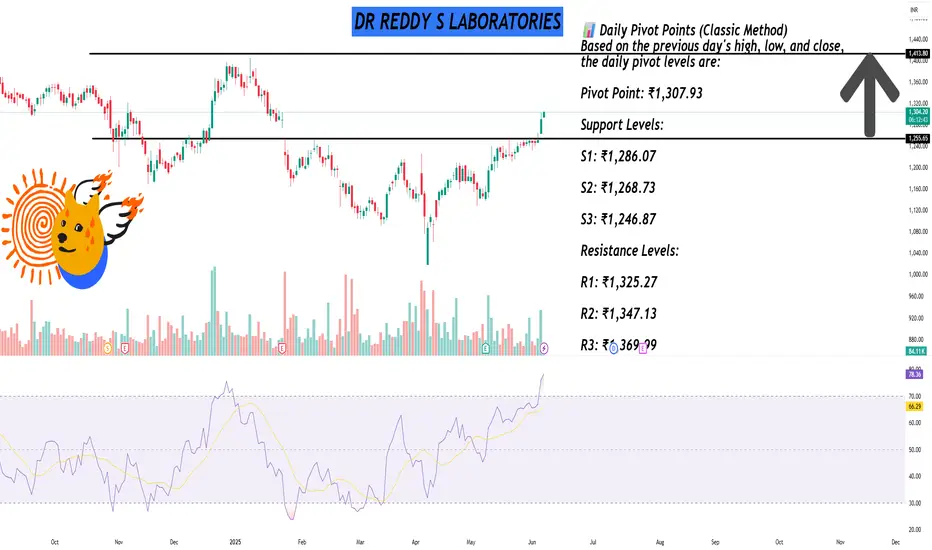
📊 Daily Pivot Points (Classic Method)
Based on the previous day's high, low, and close, the daily pivot levels are:
Pivot Point: ₹1,307.93
Support Levels:
S1: ₹1,286.07
S2: ₹1,268.73
S3: ₹1,246.87
Resistance Levels:
R1: ₹1,325.27
R2: ₹1,347.13
R3: ₹1,369.99
📈 Fibonacci Pivot Points
Using Fibonacci calculations, the levels are:
Pivot Point: ₹1,307.93
Support Levels:
S1: ₹1,286.07
S2: ₹1,268.73
S3: ₹1,246.87
Resistance Levels:
R1: ₹1,325.27
R2: ₹1,347.13
R3: ₹1,369.99
🔍 Camarilla Pivot Points
Derived using the Camarilla method:
Pivot Point: ₹1,286.07
Support Levels:
S1: ₹1,269.04
S2: ₹1,279.82
S3: ₹1,283.41
Resistance Levels:
R1: ₹1,294.19
R2: ₹1,297.79
R3: ₹1,301.38
📌 Trading Insights
Immediate Support: ₹1,286.07 (Classic S1)
Immediate Resistance: ₹1,325.27 (Classic R1)
Traders may consider these levels for setting stop-loss and take-profit orders. A break above ₹1,325.27 could signal bullish momentum, while a drop below ₹1,286.07 might indicate bearish pressure.
I built a Buy & Sell Signal Indicator with 85% accuracy.
📈 Get access via DM or
WhatsApp: wa.link/d997q0
| Email: techncialexpress@gmail.com
| Script Coder | Trader | Investor | From India
📈 Get access via DM or
WhatsApp: wa.link/d997q0
| Email: techncialexpress@gmail.com
| Script Coder | Trader | Investor | From India
관련 발행물
면책사항
이 정보와 게시물은 TradingView에서 제공하거나 보증하는 금융, 투자, 거래 또는 기타 유형의 조언이나 권고 사항을 의미하거나 구성하지 않습니다. 자세한 내용은 이용 약관을 참고하세요.