DOT/USD Weekly Outlook – Educational Perspective
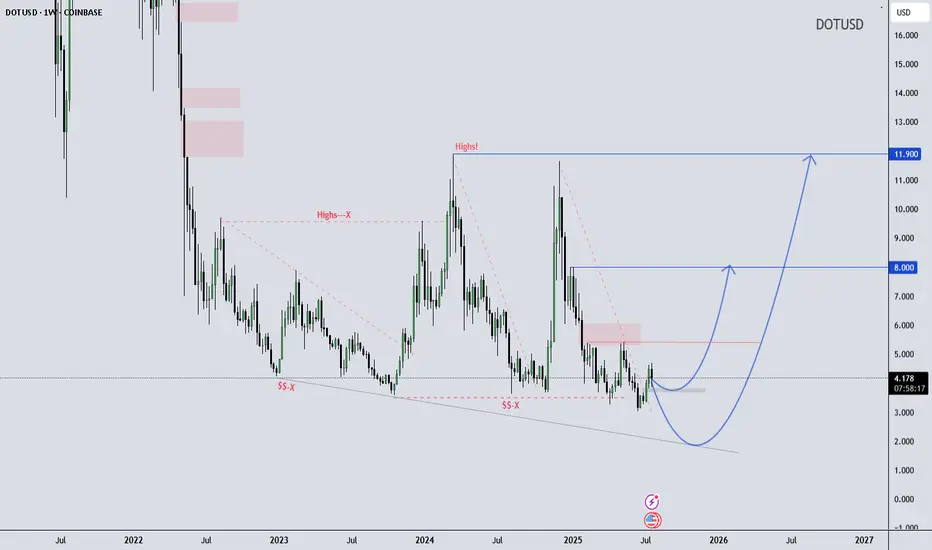
Polkadot (DOT) is trading near the lower boundary of a long-term falling wedge structure, showing early signs of stabilization around the $4.20 support zone. Price has respected this level multiple times, potentially forming a rounded bottom, which often suggests shifting momentum.
If the structure holds, it may continue developing a macro reversal pattern. This kind of formation is typically monitored by swing traders looking for high risk-reward setups in longer timeframes.
Key Technical Levels to Watch:
$8.00 – Mid-range structural resistance
$11.90 – Historical supply / macro pivot zone
This chart is shared for educational purposes only to support market structure learning. Always follow your own analysis and risk management plan.
Wave Trader Pro
Learn & Earn
액티브 트레이드
관련 발행물
면책사항
이 정보와 게시물은 TradingView에서 제공하거나 보증하는 금융, 투자, 거래 또는 기타 유형의 조언이나 권고 사항을 의미하거나 구성하지 않습니다. 자세한 내용은 이용 약관을 참고하세요.
면책사항
이 정보와 게시물은 TradingView에서 제공하거나 보증하는 금융, 투자, 거래 또는 기타 유형의 조언이나 권고 사항을 의미하거나 구성하지 않습니다. 자세한 내용은 이용 약관을 참고하세요.