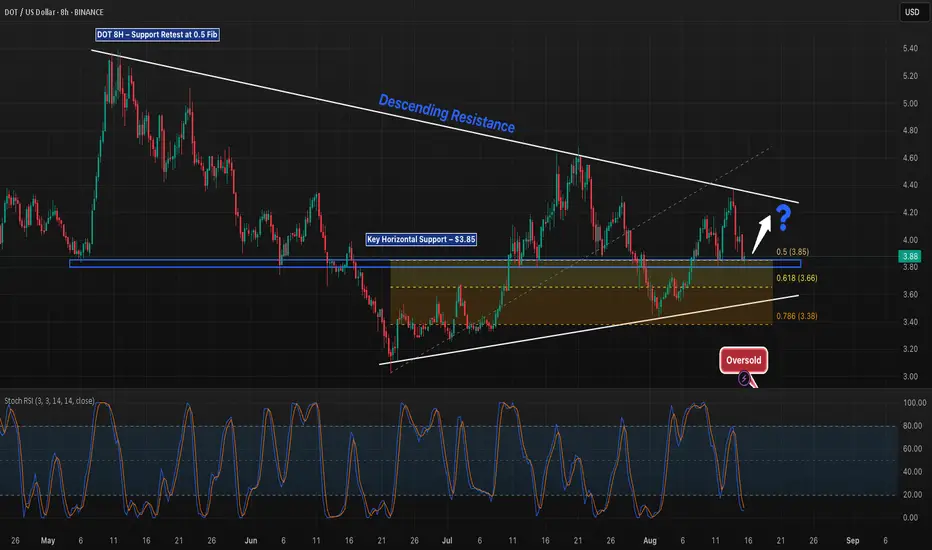
DOT is once again testing the $3.85 horizontal support, aligning with the 0.5 Fibonacci retracement from the recent swing low to high. A breakdown here opens the door to the $3.66 0.618 Fib and the $3.38 0.786 Fib, both of which align with the ascending trendline. On the upside, price faces descending resistance near $4.40, which has capped rallies since April. The Stoch RSI is oversold, suggesting possible short-term relief, but confirmation is needed to avoid a deeper retracement. Monitoring volume and reaction at $3.85 will be key for the next move.
Explore 5,000 Strategies at quanttradingpro.com
Search for the most profitable, lowest risk by symbol!
Search by indicators like Supertrend, Ichimoku, macd.
Join our discord discord.gg/2systG9frc
We provide education & tools.
Search for the most profitable, lowest risk by symbol!
Search by indicators like Supertrend, Ichimoku, macd.
Join our discord discord.gg/2systG9frc
We provide education & tools.
면책사항
이 정보와 게시물은 TradingView에서 제공하거나 보증하는 금융, 투자, 거래 또는 기타 유형의 조언이나 권고 사항을 의미하거나 구성하지 않습니다. 자세한 내용은 이용 약관을 참고하세요.