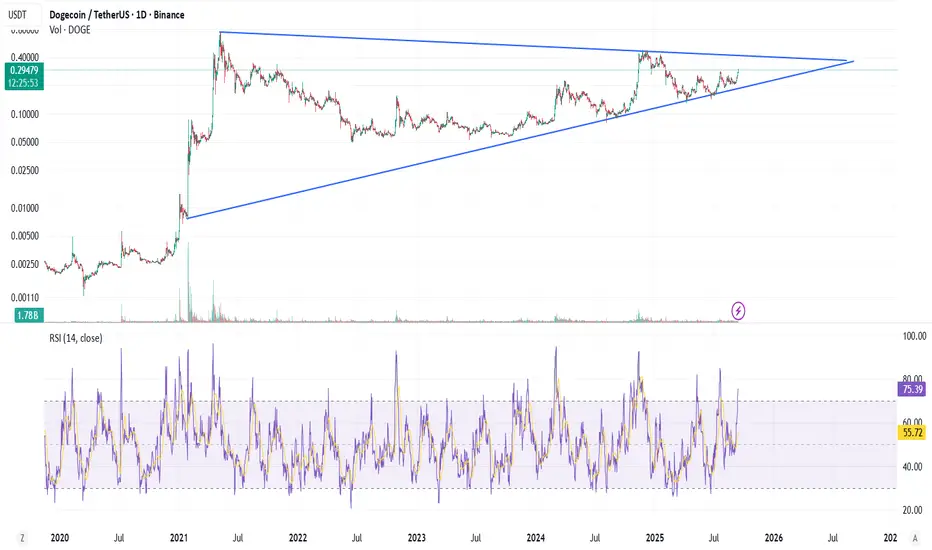
The DOGE/USDT pair is in a long-term symmetrical triangle pattern, a classic continuation pattern that suggests a significant price movement is imminent. This pattern is formed by a series of lower highs and higher lows, creating a narrowing trading range. The price is currently at a critical decision point, testing the upper resistance line of the triangle.
Key Technical Analysis:
Symmetrical Triangle Pattern: This pattern has been forming since mid-2020. The base of this triangle, from the low around $0.0011 to the high near $0.45, represents a massive price range.
Target Price Calculation: The standard way to calculate a target price for a symmetrical triangle breakout is to measure the height of the pattern's base and project it from the breakout point.
Base Height: The widest part of the triangle spans from approximately $0.0011 to $0.45, a difference of about $0.4489.
Breakout Point: A confirmed breakout would likely occur above the current resistance level, which is near $0.295.
Target Price: Projecting the base height from the breakout point ($0.295 + $0.4489) gives us a long-term target of approximately $0.7439.
Potential Scenarios & Trade Plan:
Bullish Scenario: A decisive close above the triangle's upper trend line, ideally with a significant increase in volume, would confirm a bullish breakout.
Entry: A confirmed breakout and retest of the upper trend line as support.
Target: The first major target is $0.7439. Subsequent targets would be the all-time high and potential price discovery beyond that.
Invalidation/Stop-Loss: A move back inside the triangle or a close below the lower trend line would invalidate the bullish thesis. A tight stop-loss could be placed just below the breakout level.
Bearish Scenario: A breakdown below the triangle's lower trend line, particularly on high volume, would be a strong bearish signal.
면책사항
이 정보와 게시물은 TradingView에서 제공하거나 보증하는 금융, 투자, 거래 또는 기타 유형의 조언이나 권고 사항을 의미하거나 구성하지 않습니다. 자세한 내용은 이용 약관을 참고하세요.
면책사항
이 정보와 게시물은 TradingView에서 제공하거나 보증하는 금융, 투자, 거래 또는 기타 유형의 조언이나 권고 사항을 의미하거나 구성하지 않습니다. 자세한 내용은 이용 약관을 참고하세요.