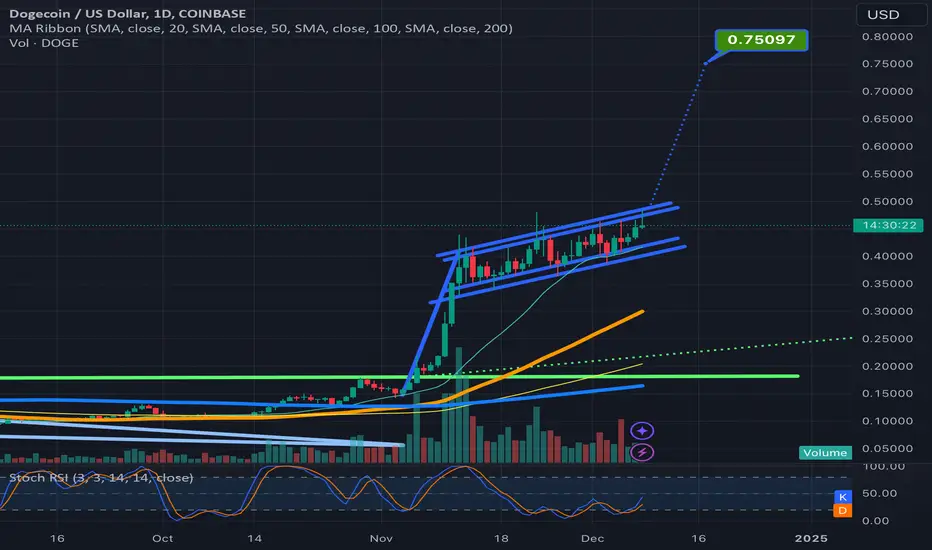
Usually an ascending channel like the one that is part of the bullflag on dogecoin’s 1 day chart beaks to the downside, except inside a parabolic phase of the bull market cycle. In the parabolic phase of a bull market cycle you can see several back to back rising wedges and ascending channels break to the upside so since we are really only 1-2 daily chart pattern breakouts into this current parabolic phase for the alt coin market, I think probability favors this ascending channel breaking upwards. If it does we also have the benefit of it being not only a channel but a bullflag as well and the target for such a breakout is around 75 cents. Furthermore if you flip to the weekly channel you would see that there is potential for the pole to be even longer than shown here on the daily timeframe, so I wouldn't be surprised if doge were able to overshoot the 75 cent target even. I noticed that the channel had valid trendlines on both the wicks and the candle bodies on both the bottom and top thats why the trendlines are doubled up, *not financial advice*
면책사항
이 정보와 게시물은 TradingView에서 제공하거나 보증하는 금융, 투자, 거래 또는 기타 유형의 조언이나 권고 사항을 의미하거나 구성하지 않습니다. 자세한 내용은 이용 약관을 참고하세요.
면책사항
이 정보와 게시물은 TradingView에서 제공하거나 보증하는 금융, 투자, 거래 또는 기타 유형의 조언이나 권고 사항을 의미하거나 구성하지 않습니다. 자세한 내용은 이용 약관을 참고하세요.