We will soon get an excellent buying opportunity in DLF.
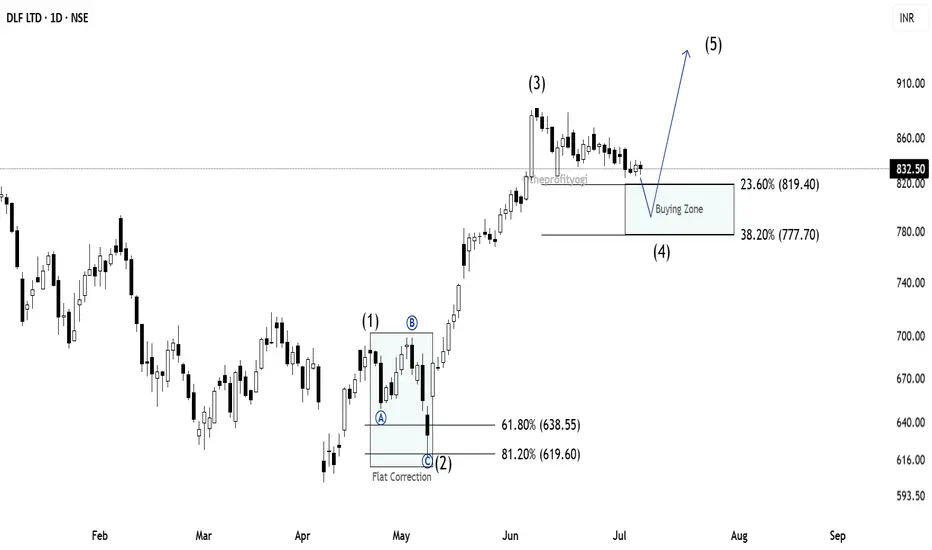
As we can see, I have marked DLF using Elliott Wave theory and Fibonacci.
You can see that, after forming wave (1), the market falls to form wave (2). In wave (2), we can see Flat Correction marked with ABC counting.
Price then moved fast, indicating a clear impulse to form wave (3).
Currently, we are in wave (4) in DLF.
As per the rule, we can expect wave (4) to terminate between 23.6% and 38.2%
This is the most probable zone where we can expect a new impulse, i.e., wave (5), to start.
One has to wait for the market to fall in this Buying zone to get a good buying opportunity.
This analysis is based on Elliott Wave theory and Fibonacci.
This analysis is for educational purposes only.
This is not a buying recommendation.
면책사항
이 정보와 게시물은 TradingView에서 제공하거나 보증하는 금융, 투자, 거래 또는 기타 유형의 조언이나 권고 사항을 의미하거나 구성하지 않습니다. 자세한 내용은 이용 약관을 참고하세요.
면책사항
이 정보와 게시물은 TradingView에서 제공하거나 보증하는 금융, 투자, 거래 또는 기타 유형의 조언이나 권고 사항을 의미하거나 구성하지 않습니다. 자세한 내용은 이용 약관을 참고하세요.